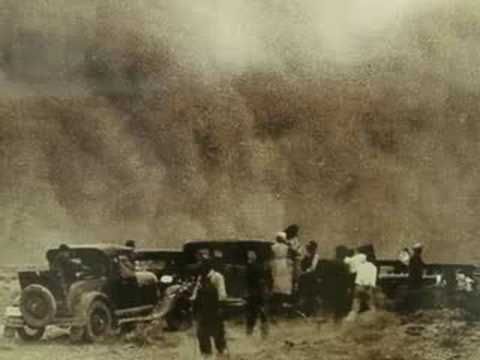
photo Memories of the Dust Bowl Pinterest 90deffe52297bcda9b2cfa8277288516
The seventh essay in a series on how American agriculture can thrive in a strenuous good-faith effort to halt global warming. The first six, earliest first, are these:
2. Comparing-carbon-footprints-of-world-and-american-agriculture
3. Fossil-fuels-in-the-carbon-footprint-of-american-agriculture
4. Carbon-tax-and-american-agriculture
5. Carbon foodprints in American Agriculture
6. Carbon sequestration and storage in soil
Abstract: A rising “carbon fee” would be un-affordable to many agriculturalists whose small businesses would get no dividend from “carbon fee and dividend (CFD)” as households would; so, most farmers and ranchers oppose CFD, though deeply concerned about the effects of weather volatility on farming today and in the future. Moreover, the decrease in carbon dioxide emissions from American agriculture expected from a rising carbon tax would be paltry compared to the drop expected in all other sectors of the economy, not worth the harm to farmers. Carbon sequestration and storage in soil (CSSS), however, would benefit agriculturalists and the whole population enormously more than simply reducing CO2 emissions from agriculture. The potential gains from CSSS in improved soil and atmosphere health should make it an integral part of the CCL exemplar for CFD. The best path to that, fair and sensible, would earmark some of the annual carbon fee revenues for direct payments to farmers and ranchers who actively sequester and store carbon.
The objective of Carbon Fee and Dividend (CFD) is to rapidly shrink the US carbon footprint, which for 2015 was about 6,703 M mt CO2-e/yr, 82% CO2 itself. (Graph 7.1) Most of the CO2 came from fossil fuel combustion (FFC).

Graph 7.1. Carbon footprint of USA ca. 2015 in million metric tons CO2-e/yr of three major GHGs, by gas: CO2 vs CH4 and N2O together. Data sources see earlier essay in this series
The blue carbon dioxide block in Graph 7.1 is the main target of a carbon tax or fee on coal, oil and gas collected “upstream.” The fee will have its biggest effect on CO2 emissions from FFC, with much less leverage on methane and nitrous oxide, the two other major greenhouse gases (GHGs).
A tax that causes a 50% decrease in FFC should bring (roughly) a 50% fall in CO2 emissions. Graph 7.2 shows how the US carbon footprint might look in two hypothetical future scenarios. With FFC down 50%, the three-GHG footprint is down 40%. With FFC down 80%, the footprint has shrunk by 2/3. If CO2 emissions went to zero (not shown), the overall footprint would be 82% smaller but could not shrink further, as the releases of CH4 and N2O are not governed by FFC. [Actually, they are, but less than CO2 emissions.]

Graph 7.2 The US carbon footprint in two hypothetical future scenarios of less fossil fuel combustion compared to current. Units and sources as for Graph 7.1
The overall carbon footprint of the country should shrink in step with falling FFC. The footprint of agriculture, however, will not show the same effect. Even though the Ag sector relies on FFC, the makeup of this sector’s carbon footprint is very different from that of the rest of the economy. Graph 7.3 (below) profiles the two sectors, Ag (677 M mt CO2-e/yr) and not-Ag (6026 M mt CO2-e/yr). For Ag, CO2 is only 23% of the sector total; for the rest of the economy, CO2 is 88%. A 50% cut in FFC for the Ag sector will reduce the three-GHG carbon footprint by just 78 M mt (-12%) while a 50% cut of FFC in all other sectors would bring down total emissions by 44% or 2,670 M mt CO2-e, a 34-fold absolute difference from Agriculture.

Graph 7.3 Carbon footprint by gas and sector, USA ca 2015
Agriculture must reduce FFC, no question. Putting the same carbon tax pressure on this sector as on all others, however, is inefficient and harmful. It delivers less gain in total GHG reductions for more pain to farmers and ranchers, who must incur new expenses to lower use of fossil fuels. Dividends from CFD to households that are not businesses will never begin to cover costs of responding to the carbon fee to which a farm household that is a business is exposed.
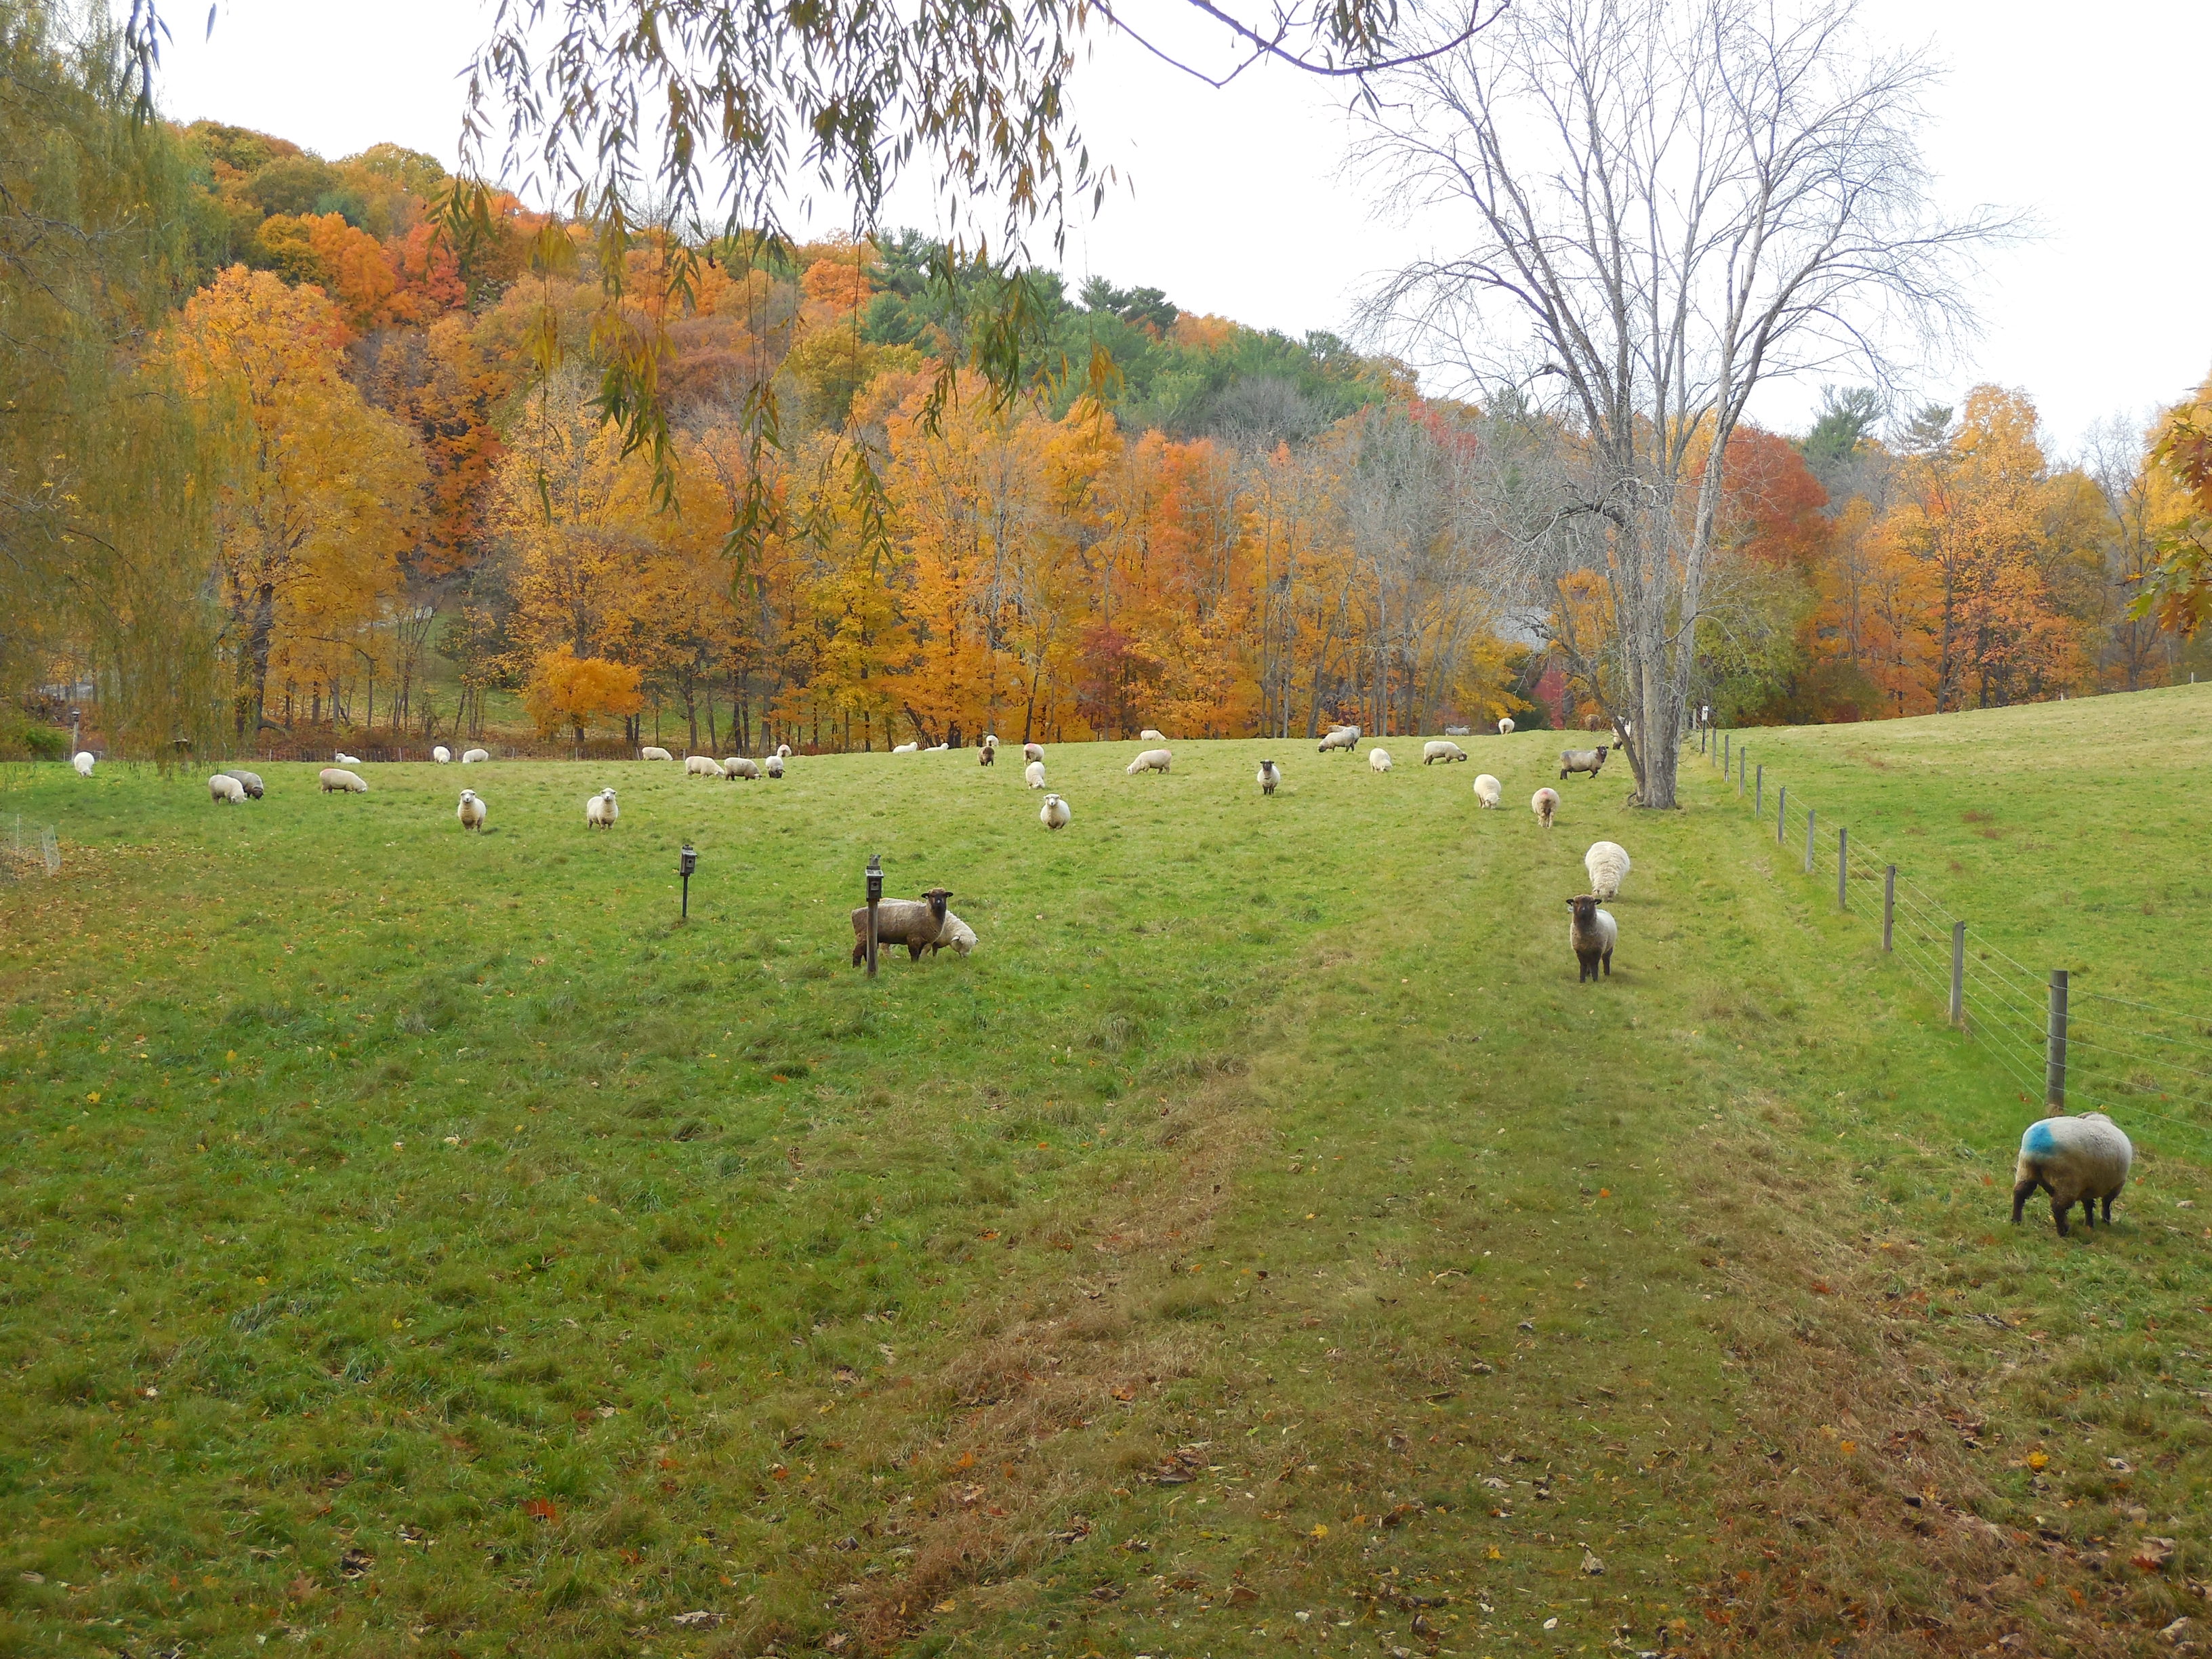
Fortunately, farming and ranching are uniquely positioned to make hay out of the country’s emergent need to radically cut emissions of CO2 and get it out of the atmosphere. Carbon sequestration and storage in soil (CSSS) removes carbon from the atmosphere. It also also improves soil’s fertility and resilience to weather volatility. With legumes planted, it can overcome the current dependence (some say addiction) to synthetic nitrogen fertilizers and biocides. By low-tech changes in management such as cover crops, no-till seeding and improved grazing of grasslands, agriculture could come close to being carbon neutral (i.e. 3-gas footprint near zero, net of emissions minus sequestrations). Only farmers and ranchers can do large-scale CSSS.
Does this sound too good to be true? The benefits of getting carbon back into soil and keeping it there are incontestable. There are of course questions about how much carbon can be sequestered and stored on US agricultural lands and on those of the whole world. Graph 7.4 uses a middle of the road estimate for a “maximal” rate of sequestration per acre to project how much carbon dioxide could be sequestered on the 2/3 of US agricultural acreage that is grassland/pasture/rangeland. (See p. 61 of this report by Garnett et al.) The highest rate shown (0.68 metric tons of CO2/acre applied by improved management to 840 million acres could sequester 571 M mt CO2/yr, about 84% of the 2015 agricultural 3-GHG footprint. Lower rates on fewer acres could sequester less, but half that rate on half those acres could sequester 143 M mt CO2/yr, more than the 121 M mt CO2/yr emitted from the whole Ag sector.
Graph 7.4 gives a conservative picture. It does not cover another 400 million acres of cropland that could also be used intensively for CSSS, at sequestration rates/acre higher than those averaged on properly-grazed grassland.

Graph 7.4 Potential for CO2 sequestration in M mt/yr by sequestration rate/acre and acreage managed with improved grazing on US grass and pasture lands
The potential for large scale carbon sequestration, though unproven, appeals strongly to ecologists and agriculturalists,. CSSS would not be a complete solution to global warming even if every acre of now or formerly agricultural land in the world could take in and store carbon at the highest rates in peer-reviewed literature. It is a wondrous strategy for the world’s ranchers and farmers to deploy in lowering GHG emissions and removing CO2 from the air. It is not a free lunch but it’s a bargain.
As I’ve explained in earlier essays, adopting even low-tech methods for switching from conventional to “regenerative” agriculture will for several years cost everyone who hasn’t already done it money and labor that many just don’t have. Distaste for being forced into an investment that one can’t afford makes many ranchers and farmers oppose CFD, dooming it legislatively. Citizens Climate Lobby is the the outstanding nonprofit organization that has proposed a CFD plan to legislators for their consideration. I and like-minded colleagues entreat CCL to revise the plan, allocating some revenues from CFD to directly help farmers and ranchers commit to CCCS.
An analogy from chemistry is apt. In graph 7.5 below, the orange line is the curve of the “activation energy” to get US farmers and ranchers rolling on CSSS. We believe the curve is too steep and too high to be surmounted if the only impetus to get over the top is the prod of the rising carbon fee on fossil fuels used by farmers and ranchers. The blue line represents a catalyzed reaction, where the catalyst is money from the carbon fee revenues. I think the choice is clear.

Graph 7.5 Schematic of activation energy curve for an un-catalyzed (orange line) reaction and the same reaction catalyzed (blue line).