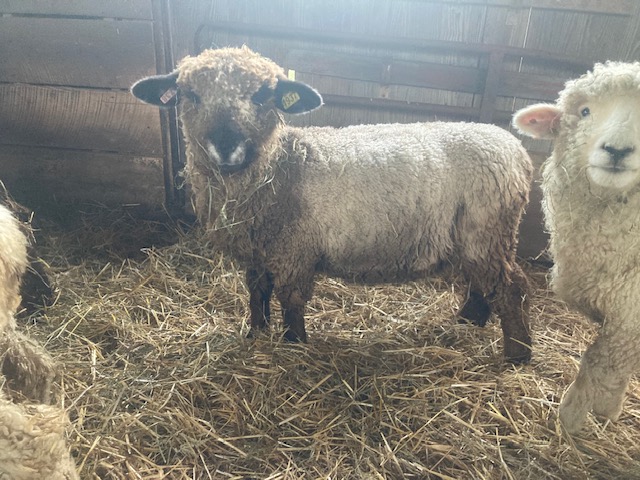
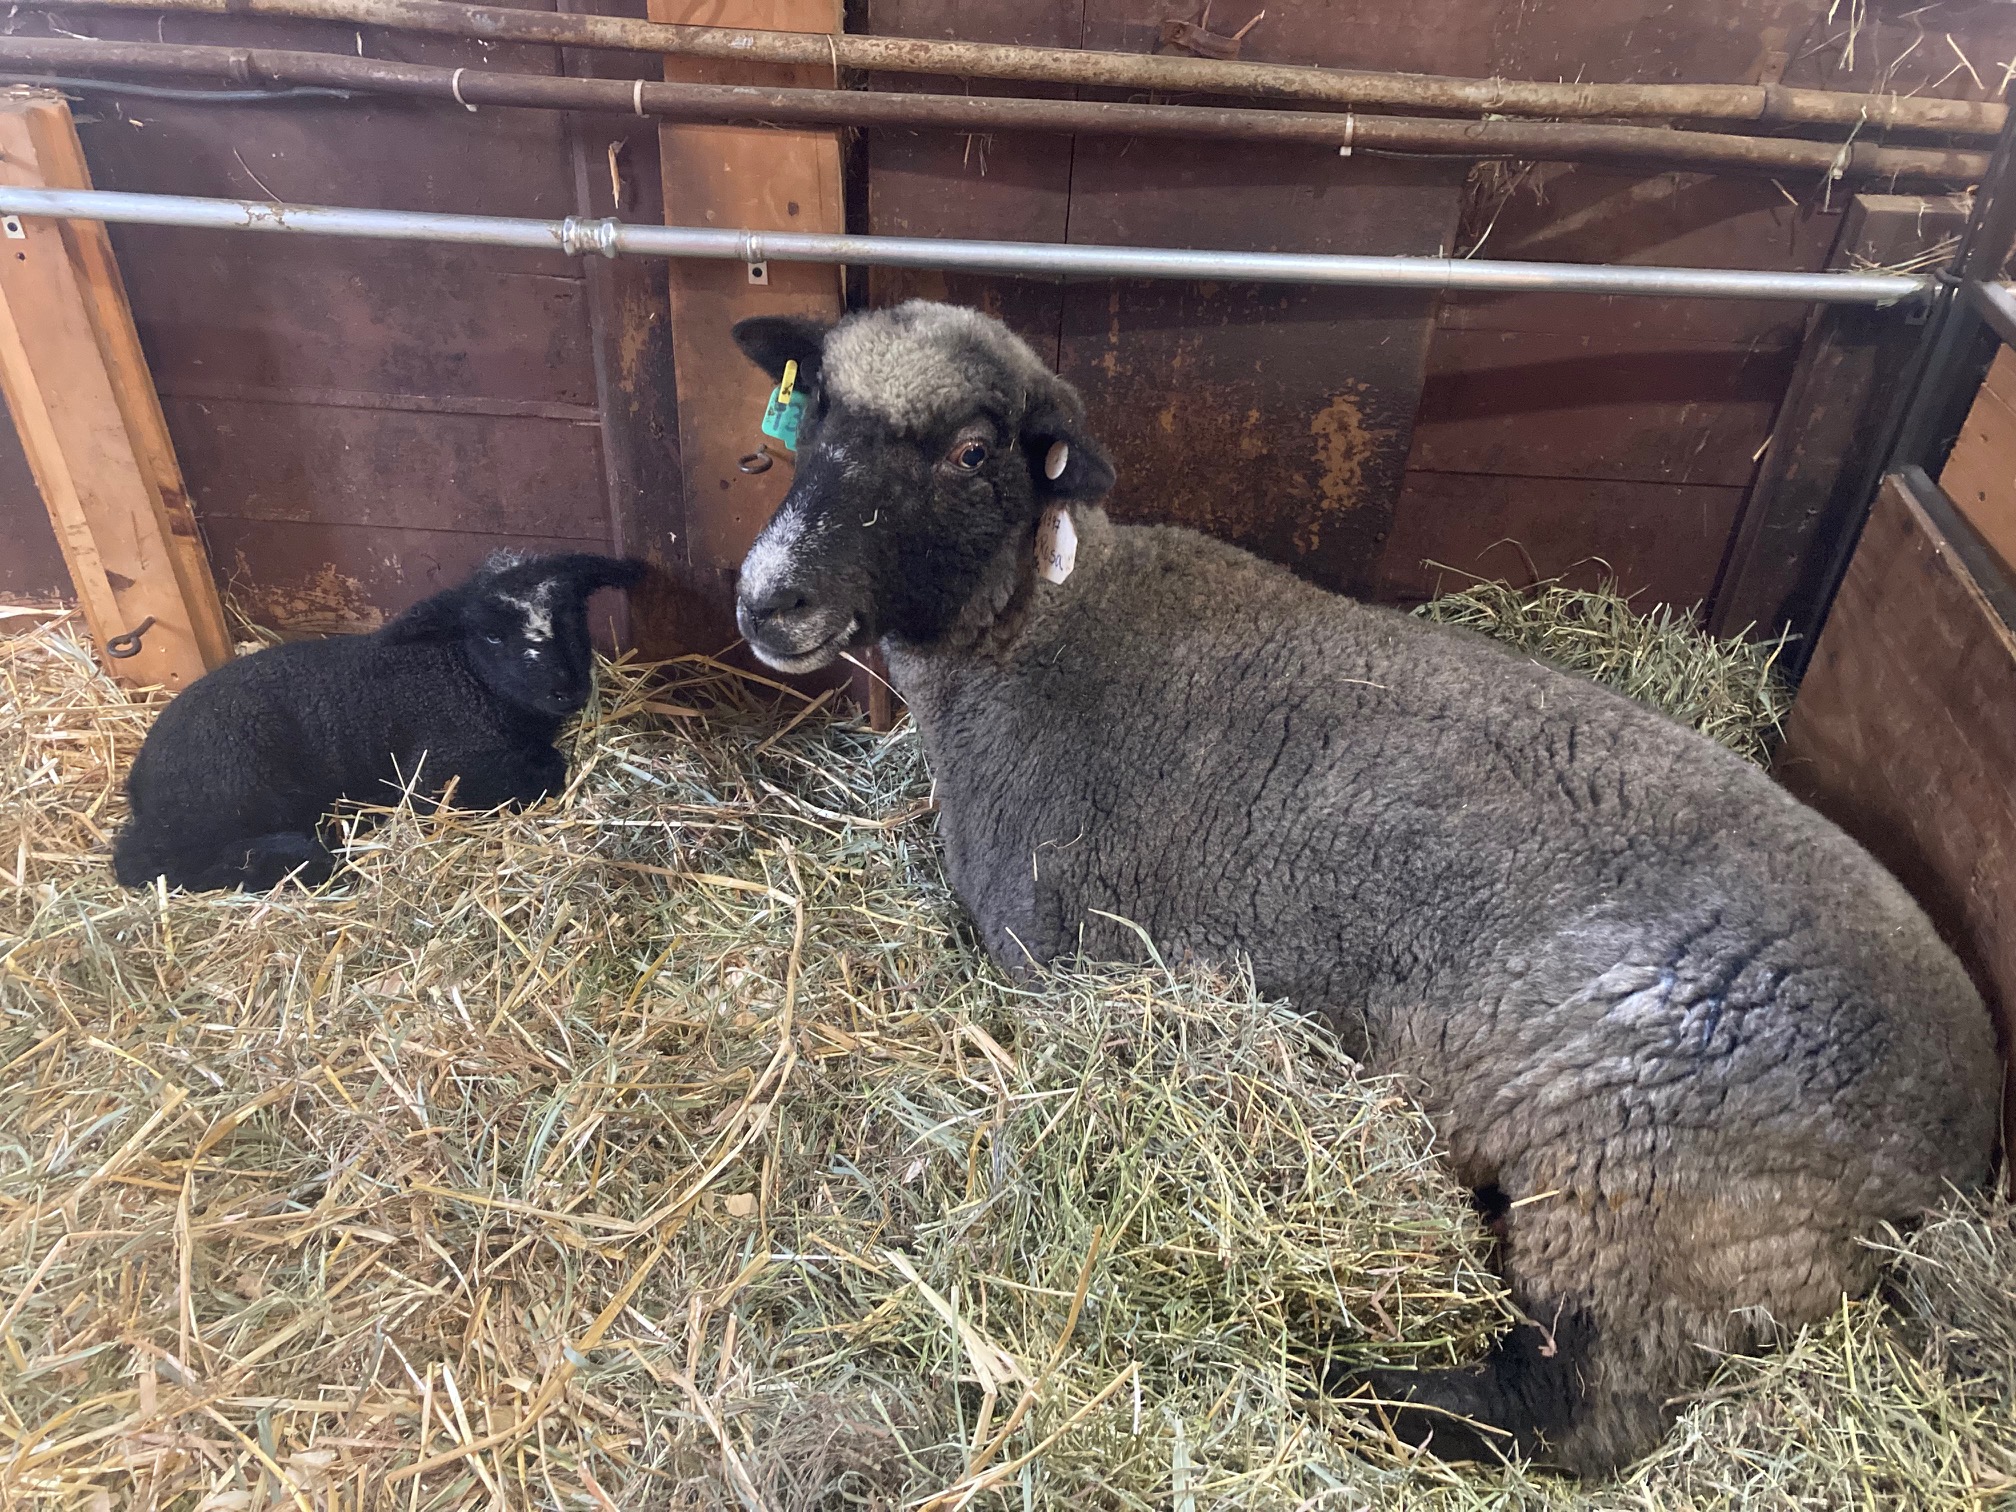
“Sylvie” photo by Stephen Shafer
The December 2024 issue of Romney Ramblings carried part 1 of a white paper about recessively-colored Romneys. This part 2 was to have come out in the next issue of Ramblings. That is now months overdue; so, I’m putting the article on our Anchorage Farm web site. It addresses why there so few registered recessive Romneys in America and what can be done to better that. After all, it’s here they first (thanks to Morris Culver) took hold, opening the door to registering colored sheep of traditionally white breeds. Ours is still the only country in which natural-colored Romneys (whether extension-dominant or agouti-recessive) are in the same purebred registry as white ones.
“Natural color,” today sought-after by many breeders, now has a foothold in some traditionally white breeds. Most such breed associations, however, do not register it. Romneys, Border Leicesters and Lincolns are the ones I know of. The others direct traffic to NCWGA.
As the proportion of Romney breeders who cultivate color in their flocks grows, many still don’t see the differences within “natural color” between “recessive” and “extension dominant” that were described in part 1. Recessive color genetics get lost in the shuffle. The show ring has a strong influence on that process.
Recessive Romneys generally don’t stand as tall nor have the body length of the extension-dominant sheep that now comprise just about all (but not all) the Natural-colored Romney class at larger shows. Also, most recessive lambs aren’t as dark as some extension-dominants. Breeders focused on major shows thus prefer extension-dominant.
Another hurdle in selective breeding for recessives is that as Romneys age, it’s hard to tell the larger and darker ones apart from extension-dominants. Characteristic white markings like small “teardrops” may be hidden by facial wool. Early post-natal inspection (photographs strongly recommended) is a must for any breeder who has natural-colored Romneys of both genotypes that may have interbred.
The language of genetics is not an incentive to everyone to go deep on sorting out where coat color patterns came from. Just reading part 1 and part 2, if you’ve got so far, probably felt like a flashback to high school biology with Mendel’s peas and terms like “alleles” “genes,” “loci,” “dominant,” “recessive,” “heterozygous,” “this locus,” “that locus,” “carrier frequency” “autosomal” “Punnett square” etc.
Fundamentally, though, all that’s really needed is to understand that natural-colored Romneys can get their coat color pattern by two different modes of inheritance, recessive at the agouti locus or dominant at the extension locus. A breeder can’t weave shadings in fleeces to taste or forecast a the coat pattern of yet unborn lamb lamb without attending to the difference. Good treatments of this topic are listed at the end.
Another reason people shy away from recessive is that it can be slow and imprecise to figure out which two of the alleles recessive at the agouti locus to the dominant Awt are being expressed. On-line chat group help from world authorities like Margaret Howard and Dee Heinrich is no longer available. Maggie is still ready and willing, however, to field individual inquiries at tawandafarms53(at)att.net. Fortunately, these two and colleagues have published a guidebook, now in its fourth edition, which is referenced below.
Romney breeders have it relatively easy when trying to nail down color alleles. Within the several dozen described at the ovine agouti locus, only five are now well-established in American Romneys. Light blue (Albl) has a lighter and more extensive display than do the others. Intermediate blue (Aibl) has been discerned only in Moorits, which are both scarce and prized. The next three get increasingly darker in color value, displaying less and less white going from dark blue (Adlb)to midnight blue (Ambl) to self (Aa). A breeder confident he or she is working with recessives can learn to categorize very young recessive lambs simply as “lighter” vs. “darker,” or on a self-styled scale like 1 to 5. This can even be done by taking notes without photos. Photos are much better; they allow reconsideration and review by a group.
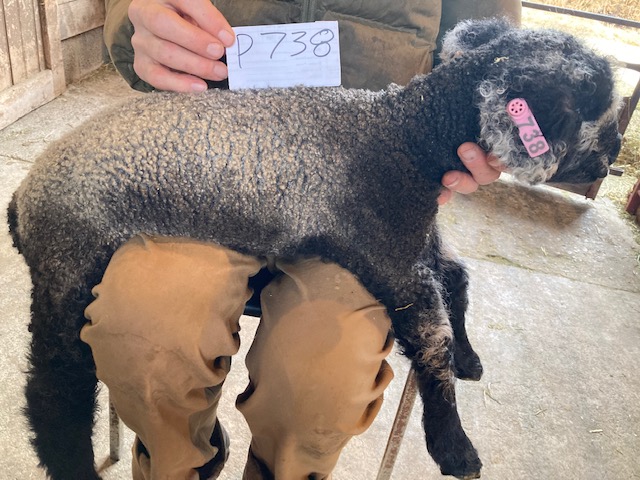
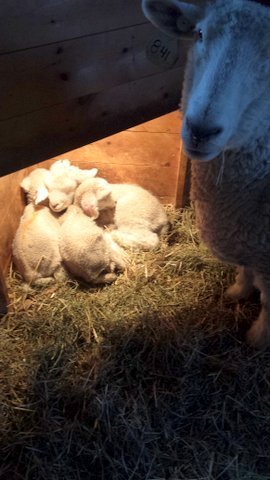
The ewe lamb below, 1937-24 BBR Tw, is on the light blue end of the Romney range.
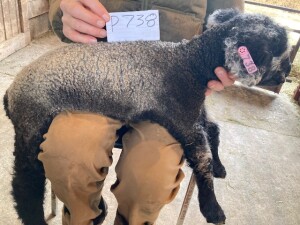
Photo Elizabeth Shafer
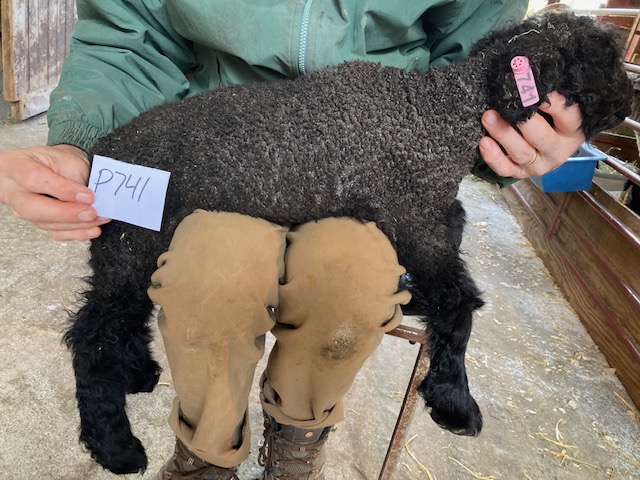
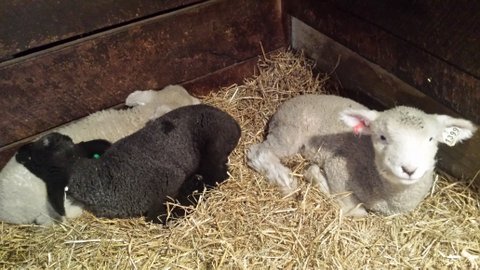
By contrast, the ewe lamb pictured below, 1945-24BBR Tw, is as about dark as an agouti recessive can be.
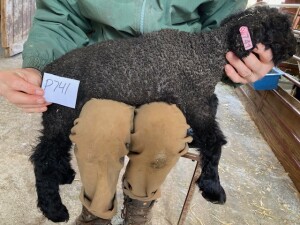
Photo Elizabeth Shafer
Maybe the worst impediment to wider acceptance is that recessive Romneys are hard to find. They are a heritage genotype within a breed that is itself not prevalent in America. Only a couple of places in the country could sell four good recessive lambs now and still have some to keep. A number, however, could let one or two go to introduce agouti color alleles to a white flock or to tease out alleles that are are latent there.
There was to have been in the same Ramblings a paid advertisement giving contact information for all the breeders in ARBA that I know are actively working with recessive color. That’s now appended to this essay. Contact me to fix omissions. sqs1(at)columbia.net. In making the list I’ve been heartened to learn that some ARBA members not listed are bringing out homozygous color in their flocks, not always deliberately, but serendipitously. The gene frequency of agouti recessive alleles in American Romneys is clearly higher than I had thought six months ago. These flocks are another potential resource for recessive breeders. It is possible sometimes to be quite sure a mature Romney is “recessive” based on inspection. Other cases may be too uncertain
Small exchanges among active recessive Romney breeders are a good step. We in ARBA need to promote what we cherish and to work with each other cross-country. Near-future imports of semen that will meet ARBA criteria are unlikely, though there are a couple of rams in Aotearoa (New Zealand) that qualify. Consequently, we “recessivists” need to keep on the lookout at home and elsewhere for reports of any apparently white x white union that left a surprise colored lamb. At Anchorage we’ve had two such over the years. In both, the parents had a common ancestor. Such surprises won’t necessarily be suitable for breeding, but some will. I encourage anyone who knows of one to contact me, especially if the union was not consanguineous or only distantly so.
This paper about recessive color in Romneys does not pretend that recessives are better for every breeder than extension-dominant. That statement is wholly untrue. It does appeal for recognition, appreciation and conservation of agouti-recessive genetics that without such attention will be submerged by extension-dominant. Seeing the difference is crucial. Closing words about agouti-recessive alleles in Romneys borrow from South Pacific “Once you have found [them], never let [them] go.”
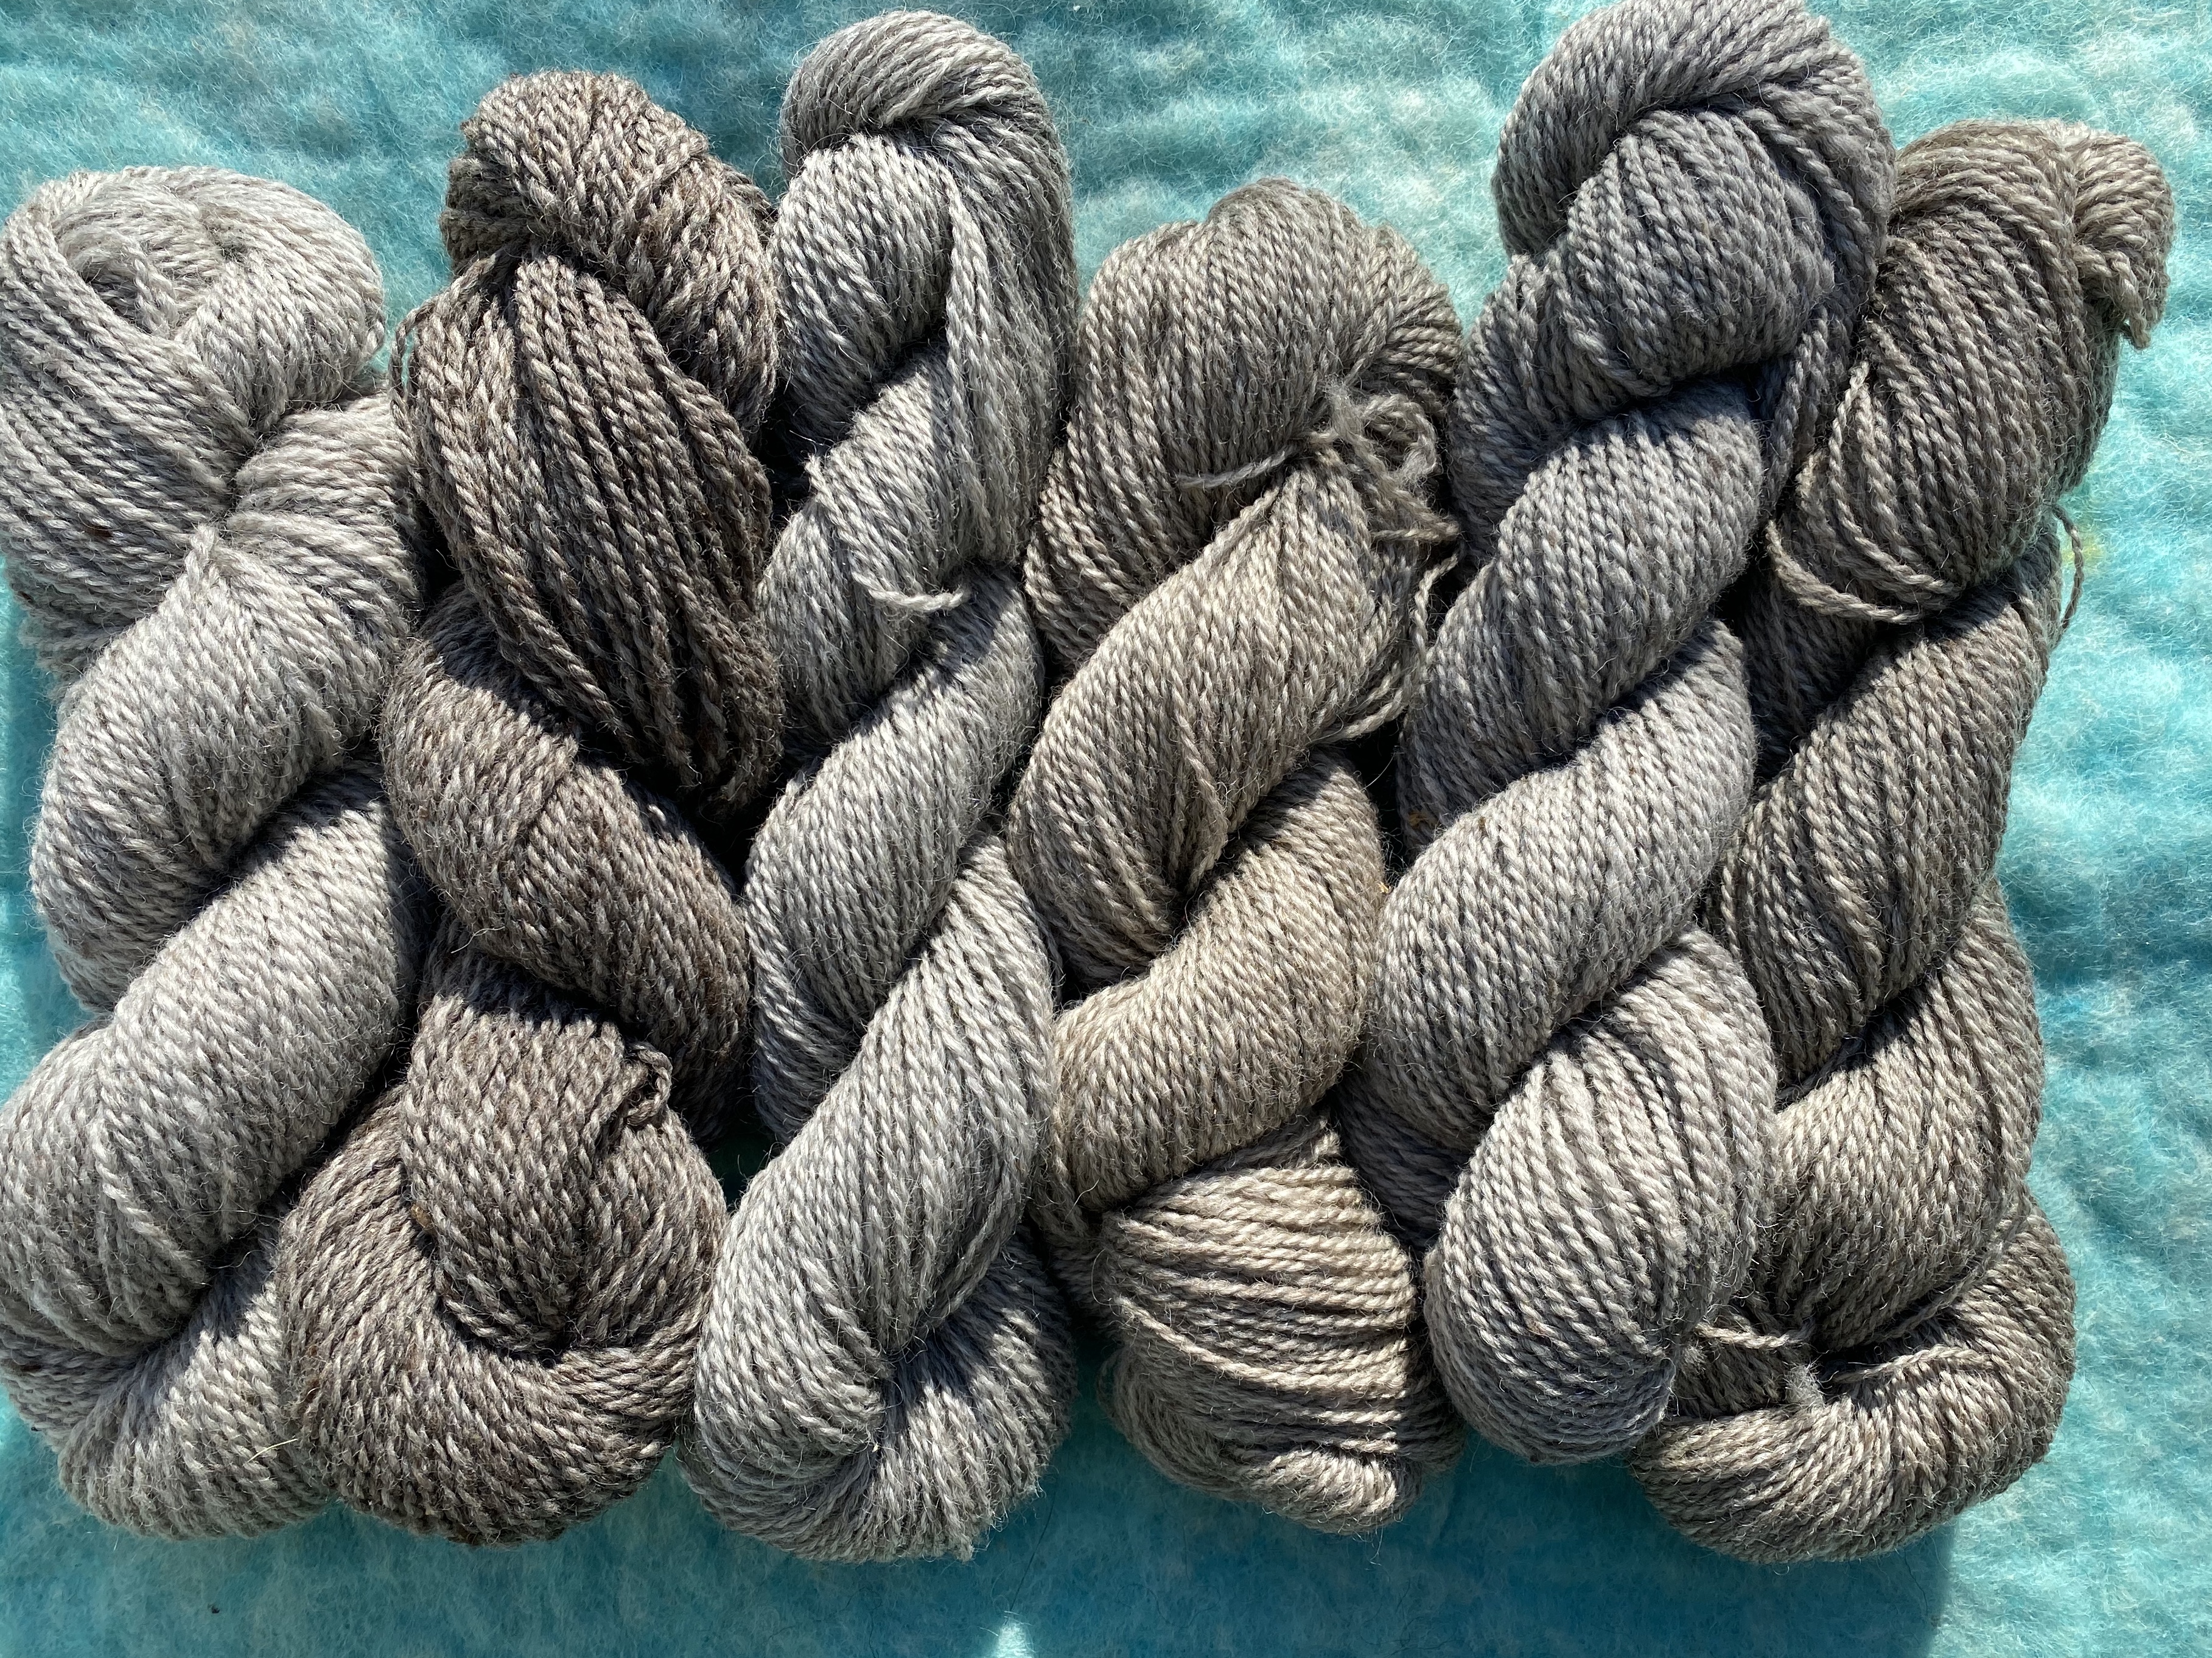
This photo of spun yarns from a recessive flock in New Hampshire is a good sign-off.
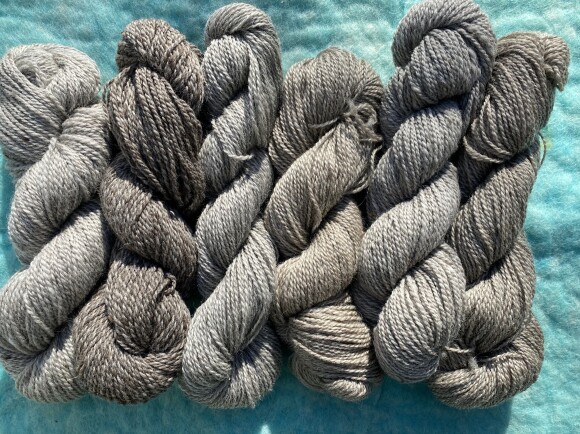
Photo by Theresa Walker
End-note on the spotting locus, which got only a few words in part 1: spotting, the wild card, is confusing. Even Dee Heinrich’s research and presentation (in Beyond the Coat) does not make the operations of this locus and its possible interactions with the E and the A loci easy to understand and explain, at least not for me. Spotting, however, should not scare anyone away from recessive color, any more than from extension dominant color. If a breeder’s goal is to eliminate it, Dee has set out guidelines, though not a sure quick path. Spotting need not be a detriment. It may be an asset for some breeders, even a fixture as it is in the Zwartbles breed. It complicates the task of identifying agouti allelotypes when it prevents wool pigmentation just where an agouti genotype does the same.
References
(on paper) Dee Heinrich, Margaret Howard, Christian Posbergh and Melissa Wubben Beyond the Coat of Many Colors: Combining the Art and Science of Sheep Color Genetics (2021) To buy, contact Margaret Howard 935 Lichens Road Montague CA email enquiries to tawandafarms53[at]att.net
(on-line) https://americanromney.org/color-genetics/basic-info/
Wendy Allison four articles
https://www.colouredsheep.org.nz/2021/11/22/genetics-how-do-we-get-coloured-sheep/
https://www.colouredsheep.org.nz/2021/12/10/moustaches-fangs-and-nose-rings-colour-pattern-and-co-dominance/
https://www.colouredsheep.org.nz/2022/02/12/why-a-brown-spotted-lamb-is-like-the-holy-grail/
https://www.colouredsheep.org.nz/2022/03/01/genetics-breaking-the-rules/
Daniel Godfrey with Wendy Allison
https://www.colouredsheep.org.nz/2023/11/12/the-dangers-of-extension-dominant/
Acknowledgements First and foremost, Margaret Howard for her vision, leadership and hard work getting recessive Romneys back into view after a near-total eclipse in the 1990s.
Margaret Howard and Dee Heinrich for a multiyear tutorial to many breeders, not just of Romneys, who wanted to learn more about color genetics in sheep.
Maggie and Dee for reading early drafts of this paper. All mistakes are my own.
Appendix list of ARBA memers interested in recessive color
A search for ARBA members who deliberately breed for recessive color built the startup list below. Disclaimer: There is no authoritative body that certifies a given Romney as “recessive,” no registry, no touchstone, no seal of approval. It’s a judgment call, grounded in attention to the genetics of coat patterns. The more the parties know about the coat pattern genotypes of a sheep’s ancestors, the more definitive the call can be. Looking at a mature natural-colored Romney is not always reliable. Reading a pedigree for BW and BB suffixes is even less so.
The difficulty in discernment is due to the high prevalence in American Romneys of “extension dominant” color. This can mimic very dark recessive patterns and will hide the white displays that betoken certain other “recessives.” In breeds without extension dominant (e.g. Icelandics, Shetlands in America), calling recessives is relatively easy. Not so in Romneys.
As compiler, I hope this starter list will stimulate interchange among listees and get them fielding many inquiries from off-list. I want it to grow, and welcome comments or questions to sqs1[at]columbia.edu regarding additions for the next version. The counts by sex pertain to homozygous recessives; where no figure is given, the latest count was unavailable at press time.
bb? “yes” means the recessives include moorits
 Here’s Rosa, age 10, with her lovely ewe lamb 2038-26