Rising unacknowledged emissions of methane from the natural gas supply chain are dangerously under-estimated as a driver of global heating and must be ended.
Stephen Q. Shafer MD MA MPH
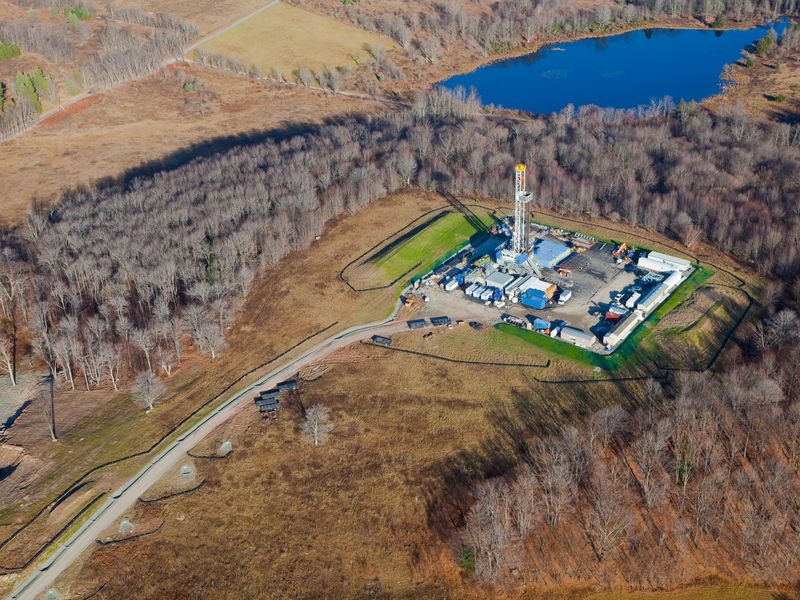
Aerial view of fracking pad in Pennsylvania photo source Smithsonian magazine
Summary: The natural gas industry is now the largest source of human-influenced methane releases to the air, in the form of “fugitive emissions” leaked from the industry’s supply chain. Though recent measurements are lacking, annual emissions are surely rising worldwide as natural gas production booms via ” fracking.” This paper presents a range of possible impacts from these fugitive emissions on the atmosphere’s growing capacity to trap heat radiated from earth over the next two decades. The range uses estimates of leakage proportions from the literature, to which a GWP20 is applied instead of the customary GWP100.
If methane emissions keep going up 2019-2023, this short-lived super-potent greenhouse gas will wreck all hopes of keeping global temperature rise under + 1.5 C as of 2030. Those hopes may already be vain. Getting total annual human-influenced methane emissions to stop rising will improve the slim chance. Natural gas production cannot be allowed to increase year-on-year. A worldwide ban on new fracking is the best action.
It’s no secret now to dedicated climate activists and fracktivists that the potent greenhouse gas (GHG) methane leaks into the atmosphere from the natural gas supply chain. Even those who’ve heard about these fugitive emissions, however, usually know them as a proportion of total natural gas production, e.g. “2%” or “7%.” It’s better to see them as a quantity that can be compared on a mass and temporo-spatial distribution basis to other streams of atmosphere-heating GHGs such as methane from livestock or CO2 emitted in air travel. This short paper provides a GHG analysis of natural gas through an assessment that though not full life cycle factors in supply chain losses, not just combustion.
To make this briefing useful to non-scientists, scientific terms and abbreviations are minimized. An unavoidable few are listed below. It supposes basic knowledge, e.g. that combusting fossil fuels releases carbon dioxide, or that natural gas is mostly methane. It skips over the physics of how greenhouse gases heat the atmosphere, which are discussed a shorter blog titled “Why We Must Control Methane Emissions Now.”
———————————————————————————————————————————————————–
cf cubic foot
CH4 methane
cm cubic meter in this context cubic meter, not centimeter
CO2 carbon dioxide
CO2-e CO2 equivalent, which measures the efficiency of a specified mass of a GHG at trapping heat in the atmosphere over a specified time horizon relative to that of an equal mass of CO2 released at the same time. CO2-e has units of mass, e.g. metric tons. To find CO2-e multiply the mass of a GHG emission by that gas’s global warming potential (GWP).
fugitive refers to gaseous emissions to air that are neither intended nor readily detectable or measurable
GHG greenhouse gas
Gt gigaton = billion metric tons = 1 petagram (Pg)
GWP global warming potential expresses the average efficiency of a GHG at trapping heat in the atmosphere over a specified time span relative to that of CO2 at the same time. GWP has no mass units, but as noted, does have a time dimension, often called the “horizon.” A 100 year horizon is most common. For short-lived atmospheric pollutants like methane a shorter horizon such as 10 or 20 years is warranted, though not adopted by the Intergovernmental Panel on Climate Change.
mt metric ton
mmt million metric tons = 1 Tg = 1 teragram = 1 megaton Tg used for methane and mmt for CO2 and CO2-e
NG natural gas
tcf trillion cubic feet
Tg teragram = 1 mmt
———————————————————————————————————————————————————-
Part 1. Why “natural gas” may not be better for the atmosphere than coal.
Natural gas is seen widely as a “bridge fuel” from coal to renewables, particularly for electricity generation , which uses about 35% of annual production. Industrial (e.g. pulp and paper, stone, glass ) uses 34%, residential 17% and commercial 12%. Its designers build and try to extend this bridge saying it causes less global warming and air pollution than would the coal (or oil) consumed in electricity generation . “Better than coal” fits over a 50-100 year future in which the proportion of natural gas withdrawn that is lost to the air as methane is low. The opposite applies to a shorter term (ten-twenty years), especially with higher loss proportion. Tanaka et al (2019) and Xiaochun Zhang et al (2016) offer good discussions of the debate with many nuances and caveats. Among the imponderables to be considered are these
- time horizon and, related to that ,
- pace at which renewable energy sources penetrate the electricity generation sector
- proportion of NG lost from supply chain as methane
I believe the time horizon must be twenty years at most. Within that time, renewable energy sources (wind and solar particularly) must be supplying most electricity. To paraphrase Fridtjof Nansen, “The impossible just takes a little bit longer.” Encouraging news comes often.
Compared to the two papers above, this discussion is primitive but illustrative. It starts by comparing the GHG emissions in metric tons CO2 due to combusting a quantity of natural (roughly 95% methane) to the emissions as CO2-e associated with losses of methane from moving that same quantity through the natural gas supply chain, from in-ground to end user pre- combustion.
Combustion of 41,900 metric tons of NG (~ = 2.16 trillion btu ~= 2.12 bcf ~ = 60 million cm ) releases 115,000 metric tons of CO2 [ @ 0.053 metric tons CO2 per million btu].
Important aside on measurement units: The quantity 41,900 mt used here has no special significance . It has roughly the same heat energy value that is contained in 100,000 cubic meters of liquefied natural gas carried by a large LNG tanker. Natural gas is not usually measured by mass. It is not seen as a greenhouse gas but as a commercial material of very low density that is theoretically 100% contained until combustion. Thus, production of it is counted in volume (e.g. cubic feet or meters) or heat value (e.g. btu or tonnes of oil equivalent), not in mass. GHGs like methane, emphatically not contained, are measured by mass. This paper is thus unconventional, but not wrong, to measure NG by mass. As cubic meters in the pipe, natural gas is “cleaner than coal, ” a “bridge fuel.” As metric tons outside the pipes it is methane, the bane of vegans and fracktivists alike, a GHG 86 to 104 times more efficient at trapping heat in its ten years of life in the atmosphere than is CO2.
A conservative estimate for the proportion of natural gas lost as unacknowledged, or fugitive, emissions of methane is 2.3%. Raimi and Aldana https://www.resourcesmag.org/common-resources/understanding-a-new-study-on-oil-and-gas-methane-emissions/ tabulated 29 reports, all after 2011. The point estimate in nine of these was 4% or higher, in four, it was >2% and <4%. In the other sixteen, it was less than 2%.
Applying five hypothetical supply-chain loss proportions (2%, 2.5%, 3%, 3.2% and 4%) to the 41,900 metric tons (~= 2.16 trillion btu) of NG in the example gives supply-chain methane losses in metric tons as 840, 1040, 1260, 1341 and 1670, respectively. All five proportions are in the lower 55% of the range given by Raimi and Aldana,
The Global Warming Potential (GWP20) of methane for a 20 year time horizon is 86, higher than the GWP100, cited in most recent places as 25 to 34. The strong case for GWP20 for methane is presented elsewhere. Applying GWP20 to a loss proportion of 3.2%, then, fugitive emissions of methane related to marketing 41,900 mt of NG amount to 115,000 mt CO2–e, equal to the release from combustion alone.
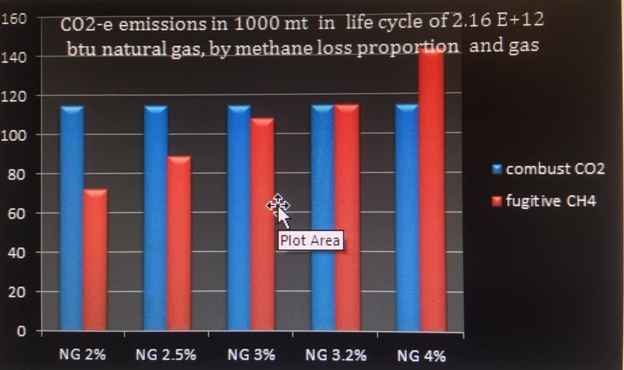
Graph 1. GHG emissions in thousand metric tons CO2-e for life cycle of 2.16 trillion btu (~=41,900 mt )natural gas, from below-ground through combustion, by proportion of natural gas lost as methane in supply chain and type of gas emitted, CO2 vs. CH4 GWP20 of 86 used for CH4. Total emissions = sum of the blue and red bars. For 3.2% losses, that is 230,000 mt CO2-e.
Graph 1 displays CO2-e emission from the life cycle of 2.16 trillion btu (~41,900 metric tons) of natural gas. The size relationships between combustion emissions of CO2 and CO2 equivalents of fugitive emissions of methane will be the same for each loss proportion regardless of the quantity of NG. With a supply-chain loss proportion of just 3.2%, for example, fugitive emissions of methane from natural gas are 1341 mt. By GWP20, this converts to 115,000 mt CO2-e, equal to the mass of CO2 released from combustion of 41,900 mt NG. Thus, marketing and burning any quantity of natural gas doubles the mass of CO2-e when the loss proportion is as low as 3.2%.
Parties promoting the expansion of natural gas use declare it’s cleaner than coal. In regard to GHG, the assertion is based only on CO2 released from combustion. Combusting 2.16 trillion btu of bituminous coal at 206 lb CO2 / million btu does emit 202,000 mt CO2, much more than the 115,000 mt CO2 from combusting 2.16 trillion btu of NG. Nonetheless, with a supply-chain methane loss proportion of only 2.5 % added to the combustion emissions, natural gas (115,000 mt CO2 from combustion plus 89,000 mt CO2-e from fugitive emissions = 204 mt CO2-e) looks worse than coal. That comparison, however, is also biased.
The 202,000 mt CO2-e figure for coal does not account for other GHG releases in the life cycle of coal from extraction to end-use, such as mining operations, washing, transportation and methane releases from underground mining. Nor does it incorporate black carbon, a short-lived aerosol enormously more efficient than CO2 at trapping heat in the atmosphere. I can’t do the math on black carbon, can only say that comparing bituminous coal to NG on a life cycle basis might show that natural gas even with (say) 4% supply-chain loss would look better for atmospheric heating than coal, btu for btu. I don’t have the needed figures.
Yet the question of which is “better” is irrelevant. Humankind cannot afford to not rapidly bring to nil CO2 emissions from all sources and to not start cutting methane emissions from all sources beginning now. Tanaka et al (2019) observe “Several studies caution about potential side-effects [of NG as a bridge fuel] —that an expansion of natural gas may delay the deployment of less carbon-intensive technologies such as renewables, representing carbon lock-in from fossil fuel infrastructure, and thereby postponing the transition to a decarbonized society.” “May” here is the wrong word. It should be “will.” Laissez faire on natural gas production subverts renewables. It’s as if in January 1942 the War Production Board had not halted all production of civilian motor vehicles in favor of war machinery but had reduced it by just 50%, proclaiming “We can do both.” We couldn’t have then, and we can’t now.
The best way to reduce methane emissions from all human-influenced sources is to go after the biggest single stream: methane losses in the natural gas supply chain. This will not be done through promises to reduce the loss proportion by upgrading equipment and procedures. It must be done by ending the growth of natural gas production before 2021, then starting a steady trend downward in production
Part 2 Global and domestic trends in natural gas marketing, and how they relate to trends in methane emissions
Figures for annual emissions of methane worldwide are probably not very accurate. There is much disagreement among different sources. A respected source is the multinational Emissions Database for Global Atmospheric Research (EDGAR). I could not find EDGAR figures beyond 2012 in the public domain. For a perspective on world emissions to that time, Graph 2 below shows stable, even slightly lessening emissions from 1990 through 2002 then a 16% rise over the next decade.
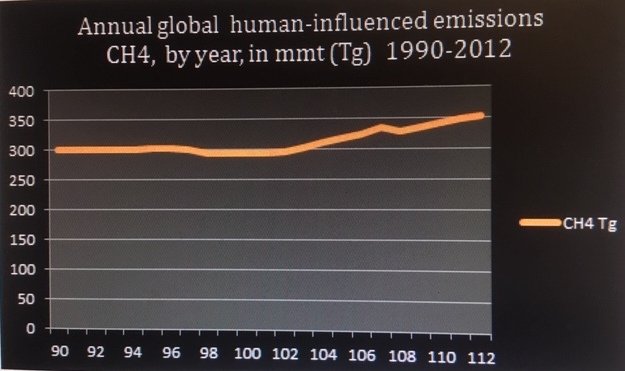
Graph 2. Annual human-influenced methane emissions worldwide by year 1990-2012 in Tg (million metric tons) Data source EDGAR graph by Shafer On the x axis, 92 is 1992, 102 is 2002 and so forth.
Worldwide production of natural gas has increased much more than have methane emissions recorded by EDGAR. over the same epoch, by about 70% 1990-2012, as seen in Figure 1 below.
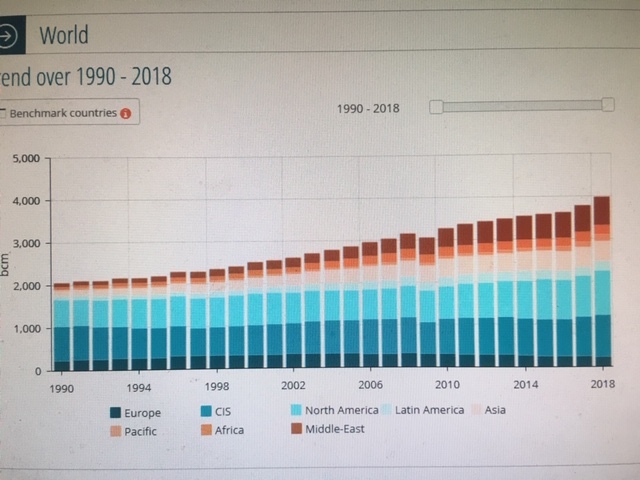
Figure 1. World production natural gas 1990-2018 by region and year in billion cubic meters https://yearbook.enerdata.net/natural-gas/world-natural-gas-production-statistics.html
Figure 2 below, from the Global Gas Report graphs later years 2010-2016 in the above series. It shows that all the considerable step-up in NG “production” since 2010 (and undoubtedly for a couple of years before that ) is “unconventional.”
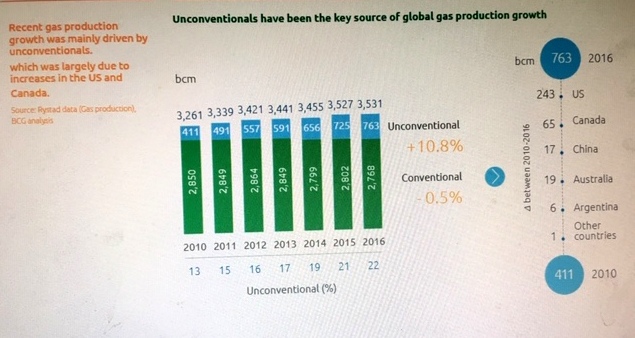
Figure 1. World natural gas/fossil gas production by year 2010-2016 and by method of production in billion cubic meters. Link to source
Extending the series in Figure 1 with a 2017 (3768 bcm) datum from another source, world production of NG rose by 507 bcm/yr between 2010 and 2017, an average of + 72 bcm/yr . That is an increase of about 48.1 million metric tons (Tg) natural gas per year during the current boom in “unconventional” production, better known as fracking. If we apply to the annual world production figures through 2017 three loss proportions within the range of estimates given above by Raimi and Aldana , a steady rise in fugitive methane emissions from the natural gas supply chain is predicted.. Graph 3 below presents this.
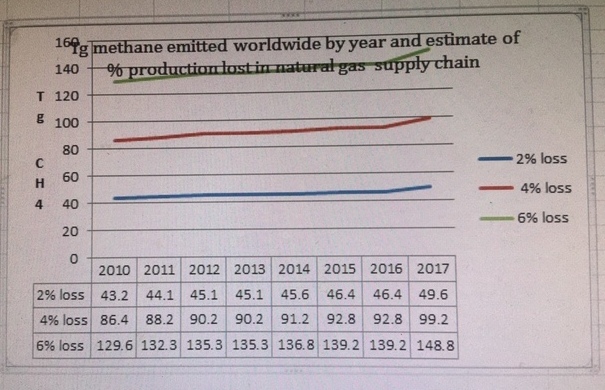
Graph 3. Imputed methane losses in Tg from natural gas supply chain worldwide by estimate of % total production presumed lost in supply chain and year Data source for NG production: p. 14 of https://www.igu.org/sites/default/files/nodenews_itemfip.ofeld_file/2018_Global_Gas_Report.pdf
Before speculating further about how much methane escapes annually from supply-chain losses, a salient question regarding the worldwide trends above must be addressed. “If methane losses from the natural gas supply system are an appreciable fraction of production, why have methane emissions risen by only about 20% in the same epoch during which natural gas production went up 70% ? “ A related, harder, question applies to the USA. “Why are recorded annual methane emissions flat or falling in this country (Graph 4 below) while natural gas production has climbed rapidly in the same epoch (Graph 5)?”
There is not a solid answer to either question, yet the divergence between natural gas production growth and official CH4 emission figures does not lessen the significance of supply-chain losses as a major source of methane. The emission figures for USA and the world are very likely under-estimated. We know that atmospheric methane levels are rising apace since about 2006 (see Appendix), and no one denies that at least some methane is lost from the supply chain. It is a safe assumption that if natural gas production is trending up steeply over time, then methane emissions from that stream are as well.
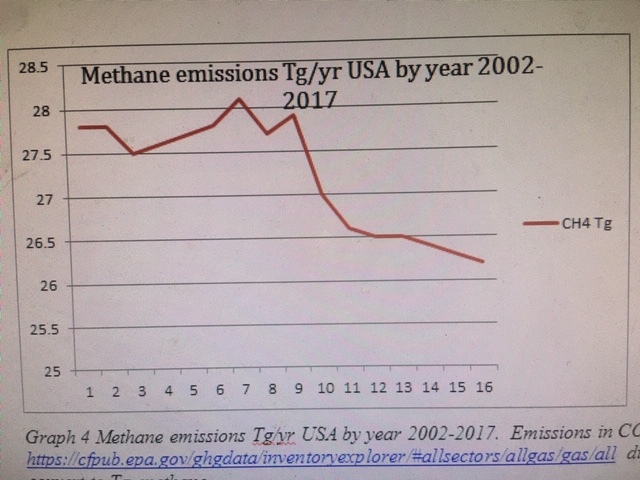
Graph 4 Methane emissions Tg/yr USA by year 2002-2017. Emissions in CO2-e from source https://cfpub.epa.gov/ghgdata/inventoryexplorer/#allsectors/allgas/gas/all were divided by GWP100 figure of 25 to convert to Tg methane.
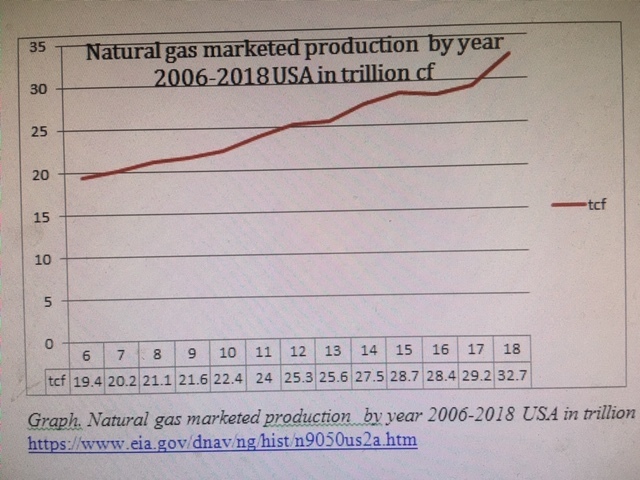
Graph 5. Natural gas marketed production by year 2006-2018 USA in trillion cubic feet data source https://www.eia.gov/dnav/ng/hist/n9050us2a.htm
Part 3. Projecting the amount of methane fugitive emissions and their contribution to atmospheric heating-up
Returning to graph 3 above, the 4% figure for 2017 is 99.2 Tg/yr. 4% is slightly above the median value for loss % among the twenty-nine reports tabulated by Raimi and Aldana mentioned above. 99 Tg/yr is less than the 157 Tg/yr for a recent year attributed to the oil and gas sector by Howarth in a 2019 lecture, but close to the 96 Tg ascribed by Saunois et al to “fossil fuels” for 2012. 99.2 Tg CH4 adjusted by GWP20 means 8.5 billion metric tons CO2-e of methane worldwide for one calendar year from NG alone. Whatever one sets as an acceptable carbon budget for up to whatever future year one chooses, 8.5 billion metric tons CO2-e in one calendar year from just one of several sources of the second-most important GHG is intolerable.
Non-CO2 GHGs (methane, nitrous oxide and F-gases) and aerosols are not counted in most carbon budgets, in which aggressive mitigation is [prayerfully] assumed. If they were, the budgets for molecular CO2 itself would have to be smaller than those proffered, and very much smaller when GWP20 of 86 is used for methane, (as it should be for any epoch less than twenty years).
Some idea of the role of methane in a hypothetical all-GHG accounting (as opposed to one for CO2 only) can come from USA data; comparable figures for the world are hard to find. From a recent EPA inventory through 2017, Tg of methane emitted from all human-influenced sources for each chosen year were calculated by dividing the CO2-e listed in mmt by 25, the GWP100 for methane often used by EPA. Multiplying that imputed CH4 annual release in Tg (mmt) by GWP20 of 86 returned a much higher value for methane emissions in CO2-e than is shown in the EPA table. The results appear in graph 6 . For each of the four years included 2002-2017, there are two columns. The CO2-e ascribed to each gas in the original EPA table is shown in column a, while column b shows the CO2-e when methane has a GWP20 of 86. On the average, the grand total in column b is about 24% higher than that in column a and the share of total due to methane almost three times higher.
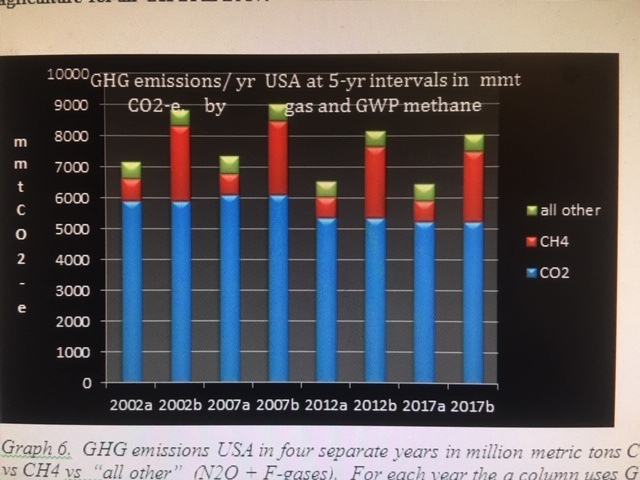
Graph 6. GHG emissions USA in four separate years in million metric tons CO2-e, by gas (CO2 vs CH4 vs “all other” (N2O + F-gases)). For each year the a column uses GWP100 for methane and the b column GWP20
Graph 6 is most disturbing. It shows that when methane is given a GWP20, total US GHG emissions as CO2-e have been, are being or will be under-counted by about 24% , approximately 1.6 Gt CO2-e (1.6 billion metric tons CO2-e). 1.6 Gt CO2-e is more than the emissions (1.4 Gt CO2-e) of the entire industrial sector of the USA in 2015. Fugitive emissions from fossil fuels (largely natural gas) make up, conservatively, 40% of that 1.6 Gt CO2-e or 640 mmt CO2-e . This is more than the 582 mmt CO2-e attributed (using GWP100 of 25 ) to agriculture for all GHGs in 2017.
No matter what GWP is used , the fact remains that, because of methane’s short lifetime in the atmosphere, emissions rising at any rate add to atmospheric heating-up. Level annual emissions contribute to atmospheric heating without adding to it, while falling total emissions cause relative cooling. If humankind wants a fighting chance of keeping global average surface temperature less than 1.5 degrees centigrade higher after 2030 than it was in the pre-industrial baseline, natural gas withdrawals must stop rising year-on-year in 2020. This turnaround is the only avenue for significant course correction on GHG management over the next ten years that can have a discernible effect when those years have elapsed.
As Figure 1 showed, all the annual increment in natural gas production worldwide in the last decade is due to “unconventional methods” i.e. fracking. A worldwide ban on new fracking must be enacted in 2019. The US should lead.
Thanks to Ken Dolsky for his meticulous help with line-editing All remaining errors of orthography or clarity or fact are on my head.
Permission is hereby granted to reproduce this blog elsewhere in whole or in part as long as the permalink is cited . http://www.anchorageromneys.com/2019/08/methane-madness/
Appendix on trends in atmospheric methane levels
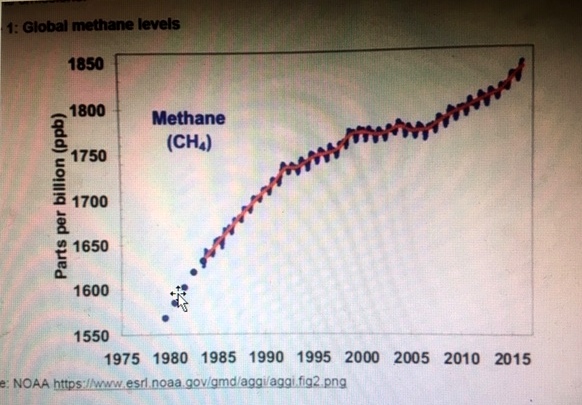
Global atmospheric methane levels have risen enormously in the last 150 years. Click on the link to see a graph too faint to reproduce here. Since about 2006 there has been a decided upsurge after a brief plateau
Additional readings.
https://opinionator.blogs.nytimes.com/2013/09/24/is-natural-gas-clean/
https://yearbook.enerdata.net/natural-gas/world-natural-gas-production-statistics.html
Millar et al (Nature Geoscience Sept 18 2017:10:741-747) 850 Gt CO2-e
Glen Peters Beyond Carbon Budgets Nature Geoscience 11 June 2019 378-383
https://www.eia.gov/dnav/ng/ng_prod_sum_dc_NUS_mmcf_m.htm
https://www.eia.gov/dnav/ng/TblDefs/ng_prod_sum_tbldef2.asp
https://www.eia.gov/dnav/ng/hist/n9010us2a.htm withdrawals
https://www.eia.gov/dnav/ng/NG_PROD_SUM_DC_NUS_MMCF_A.htm withdrawals and production
Katsumasa Tanaka, Otávio Cavalett, William J. Collins & Francesco Cherubini Asserting the climate benefits of the coal-to-gas shift across temporal and spatial scales Nature Climate Change volume 9, pages 389–396 (2019)
Xiaochun Zhang, NP Myhrvold, Z Hausfather K Caldeira Climate benefits of natural gas as a bridge fuel and potential delay of near-zero energy systems Applied Energy (2016) 167: 317-322 https://www.sciencedirect.com/science/article/pii/S030626191501243X?via%3Dihub