CO2-e , CO2-e* and CO2-we: Divergent Metrics for Methane’s Additions to Atmospheric Heating in Scenarios of Sub-optimal or no Mitigation.

photo of a playground in Butler Co PA USA next to a fracking pad is by Moms for Clean Air Force source: www.climatevisuals.org
Summary: I did simulations using the GWP and the variant GWP* framework for future scenarios of annual methane emissions that trend over 10-20 years to be level or falling. In these hypothetical “ambitious mitigation” scenarios, emissions of the short-lived climate pollutant methane after about ten years don’t add to atmospheric heating even when the GWP approach would say they do. No paper I could find quantifies the difference in future additions to heating predicted by GWP* vs GWP methods when methane emissions trend up as they must be these days. With simple algebra, CO2-e derived from GWP was compared to CO2-e* derived from GWP* framework and to the yet-newer metric CO2-we for both slow rise and faster rise. For annual increases less than 1.25%/yr over baseline, CO2-e predicts more addition to atmospheric heating than does CO2-e*. For higher rates of annual increase, however, CO2-e* and CO2-we both exceed CO2-e. The “star” methodology ( yielding CO2-e* or CO2-we rather than CO2-e) should become the norm for methane. It shows the benefits of ambitious and even of suboptimal mitigation. It highlights the dreadful consequences of letting natural gas withdrawals continue to rise as steeply as they have been in the United States (66% increase 2006-2018).
A multi-national group of climate scientists holds that the standard GWP is not appropriate to compare the warming effect of the short-lived climate pollutant methane, a flow gas, to that of a stock gas, CO2. For methane they advocate a metric that scales with rate of change in emissions, not with average annual emissions. They call this GWP* (spoken as “GWP star”). GWP* is a concept, not a constant value like GWP. Two metrics of comparison derived from it are CO2-e* and CO2-we (for “warming effect”) rather than CO2-e.
The group rarely if ever give numeric examples in their publications. They use graphs or schematic plots of “warming effect” over time derived from GWP* See this article for non-scientists by Dr. Michelle Cain. The schematics show no addition to “warming effect” after ten to twenty years with level or falling methane emissions, but do show addition after a like span of years with rising emissions. In contrast to plots based on GWP*, all projections of future warming effect from methane derived from the conventional GWP show addition.
Note well: In this paper all emissions of CO2 or of CH4 are human-influenced.
I’ve not seen any of this group’s publications say as much, but to me CO2-e* equals zero in a future scenario of emissions level for ten years. It takes a value less than zero (i.e. negative) in a scenario of ten years of declining emissions. What can be learned, however, from using CO2-e* instead of CO2-e in today’s climate with undoubtedly rising methane emissions? (Methane levels in the atmosphere have been rising in the last few years; we must assume that methane emissions have, too.) Wanting concrete examples of using GWP* (spoken as “GWP star”) for rising emissions, I applied to simulated data sets of methane emissions 2020-2034 three ways to calculate a CO2 equivalent for methane that reflects accurately the difference in how the atmosphere handles methane as opposed to CO2.
- the standard, using GWP, that returns CO2-e
- the variant using GWP* described in Allen et al 2018 ; that returns CO2-e*
- and a modification reported in September 2019 by Cain et al that yields CO2-we (for warming equivalent)
Let E stand for methane emissions of one year. GWPH is the global warming potential for a time horizon of H years, usually 100 or 20. E multiplied by GWPH does not tell one how much, if anything, methane adds to heat-trapping [radiative forcing] after that year because some of the methane molecules that had entered the atmosphere in earlier years left it in the year of observation, oxidized in the “methane sink.” Therefore, when methane emissions over ten years have been declining or absolutely level, the Et of the last year in the series, no matter what its size, will not add to total radiative forcing in the atmosphere. It will not increase warming, though it of course sustaining it. The first three pairs of graphs in my October 10 “CO2-e is a Wrong Metric “ blog explain this behavior.
When methane emissions have been rising over those years, Et does add each year to future atmospheric heating, as seen in the fourth pair of graphs in “Wrong Metric.“ How much it adds, though, is still not the product of Et multiplied by GWPH, as would obtain with CO2 or N2O. To explore the different relationship, I tried o figure out exactly how the GWP* group proposes to transform methane emissions into a variant of CO2-e when methane emissions are rising over ten to twenty years. They call the variant CO2-e*.
Here’s how I interpret Allen et al 2018 npj Climate and Atmospheric Science (2018) 1:16 ; doi:10.1038/s41612-018-0026-8 . I have rewritten their equation for
methane CO2-e* to compare to CO2-e, where the latter = Et multiplied by GWP100.
y is the number of years from time zero t0 to time t tt They advise 20 year time span
H is time horizon; they choose 100 years
E0 emissions in year 0 in Mmt (million metric tons). Methane as a substance is often counted in teragrams (Tg) which = Mmt. I will use Mmt for methane as it is more familiar than Tg.
Et emissions in year t in Mmt
CO2-e* = (Et minus E0) multiplied by GWPH multiplied by H/y
My example, not theirs. They don’t give one.
E0= 300 Mmt Et = 340 Mmt y = 20 yrs H is 100
For GWPH they use 28
CO2-e* = 40 * 28 * 100/20 = 5600 Mmt CO2-e* in year t
CO2-e in same year calculated as product of GWP times Et = 9520 Mmt CO2-e, which is greater than 5600 Mmt CO2-e*. The rate of growth of emissions over these 20 years averages out to 0.67% of baseline per year. Table 1 below compares CO2-e* to CO2-e for different average annual growth rates. Time horizon is 100 years, with GWP of 28.
Table 1 also shows another variant metric to adjust CH4 emissions to those of CO2. It is called CO2-we for “warming equivalent.” The formula for that quantity per Cain et al (2019) is
GWPH times [75 ( delta ECH4 )/delta t) + 0.25 E0] where delta t = 20 years and delta ECH4 = Et minus E0
In the example above CO2-we = 28 (75 times 40/20 +0.25 times 300) = 28 (150 + 75) = 6300 Mmt
|
E0 |
Et |
20-yr incr |
avg ann |
CO2-e* |
CO2-we |
CO2-e |
|||||
|
inc as % |
|||||||||||
|
300 |
320 |
20 |
0.33 |
2800 |
4200 |
8960 |
|||||
|
300 |
340 |
40 |
0.67 |
5600 |
6300 |
9520 |
|||||
|
300 |
360 |
60 |
1 |
8400 |
8400 |
10080 |
|||||
|
300 |
380 |
80 |
1.33 |
11200 |
10500 |
10460 |
|||||
|
300 |
400 |
100 |
1.67 |
14000 |
12600 |
11200 |
|||||
|
300 |
420 |
120 |
2 |
16800 |
14700 |
11760 |
|||||
|
|
|
|
|
|
|
|
|||||
|
|
|
|
|
|
|
||||||
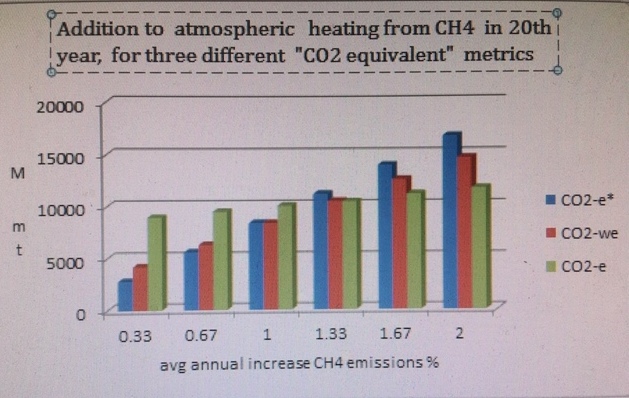
Graph 1. CO2-e* compared to CO2-e and to CO2-we for CH4, in the last year of a 20 year series, by average annualized increase in emissions as % of baseline. 100 year horizon GWP 28 Data are hypothetical
The three metrics do not have a fixed relationship across the range of small to medium average annual increases. CO2-e* and CO2-we are both less than CO2-e until the average annualized increase hits a (rather low) 1.25%. Above that, CO2-e* and CO2-we are both greater than CO2-e. At that point , the familiar CO2-e for methane based on GWP100 becomes an under-estimate of future warming effect, where it had been an overestimate in all scenarios with a lower rate of annual increase.
How likely is it that the world will see annual increments in methane emissions that on average exceed 1.25 % of baseline inventory over the next ten years? The outlook is ominous. Natural gas withdrawal rates will be a key determinant, though fugitive emissions from the NG supply chain are not the only source of human-influenced methane emissions.
Natural gas production is projected to increase by an average of 101 billion cubic meters each year 2018-2023, slightly more than the average annual increase over 2006-2017. How might that affect future methane emissions? To convert from cubic meters natural gas to metric tons CH4 lost from supply system, one can use the equation below setting the loss proportion at a conservative 3.5% and letting Y = 101 bcm
0.65 E-03 mt CH4/cm NG * Y E+9 cm NG * .035 = .023 Y E+6 mt = .023 Y Mmt CH4
The expected increase in total annual methane emissions from that source is 2.3 Mmt/year.
Assume very conservatively that starting in 2006 methane emissions from natural gas went up along with rising NG production, each year by 2.3 Tg methane. This would have added 2.3 Tg/yr from natural gas to the 300 Tg/yr baseline conjectured for illustration to be E0 in 2006. The value for CO2-e* in 2018 based on years 2006-2018 is (327.6 minus 300) multiplied by 28 multiplied by 100/12 = 6440 M mt. CO2-we is 6930 Mmt. CO2-e is 327.6 multiplied by 28 = 9172 M mt.
With methane emissions rising in this illustrative-only example 9.2% over 12 years (annual average 0.76%), the “star” method for calculating CO2-e in 2018 based on rate of change in emissions (CO2-e*) and the warming equivalent (CO2-we) variant both return a lower figure than the conventional method based on yearly emissions. If, however, the yearly increment in methane emissions 2006-2018 actually averaged 4 Tg instead of 2.3 Tg, CO2-e* in 2018 is 11,200 M mt and CO2-we is 10,500. Either is more than CO2-e of 9744 M mt. Now CO2-e understates CO2-e*. In this higher range of annual rate of change, methane emissions expressed as CO2-e will be under-rated, a terrible mistake.
Acknowledgments: I thank for their gracious help in my exploration of methane and other climate projects the following scientists: Michelle Cain, Oxford Martin School, University of Oxford; Ruth DeFries, Columbia University; Gidon Eshel, Bard College; Steven Hamburg, Environmental Defense Fund; Robert Howarth, Cornell University; John Lynch, Food Climate Research Network University of Oxford; Frank Mitloehner, UC Davis; Bryce Payne, Wilkes University and Gas Safety, Inc; Sara Place, National Cattlemen’s Beef Association; Jeanne Stellman, Columbia University; Evelyn Wright, Sustainable Energy Economics, Kingston NY Thanking them does not imply their endorsement. I am responsible for any errors of fact or interpretation. All opinions expressed are my own.
Permission is hereby given to quote at any length from this blog so long as the permalink is cited http://www.anchorageromneys.com/2019/10/divergent-metrics-for-methanes-heating-effect/
Stephen Shafer MD MA MPH Saugerties NY 12477 Oct 10 2019 e-mail s qs1 at columbia.edu