Methane Manifest
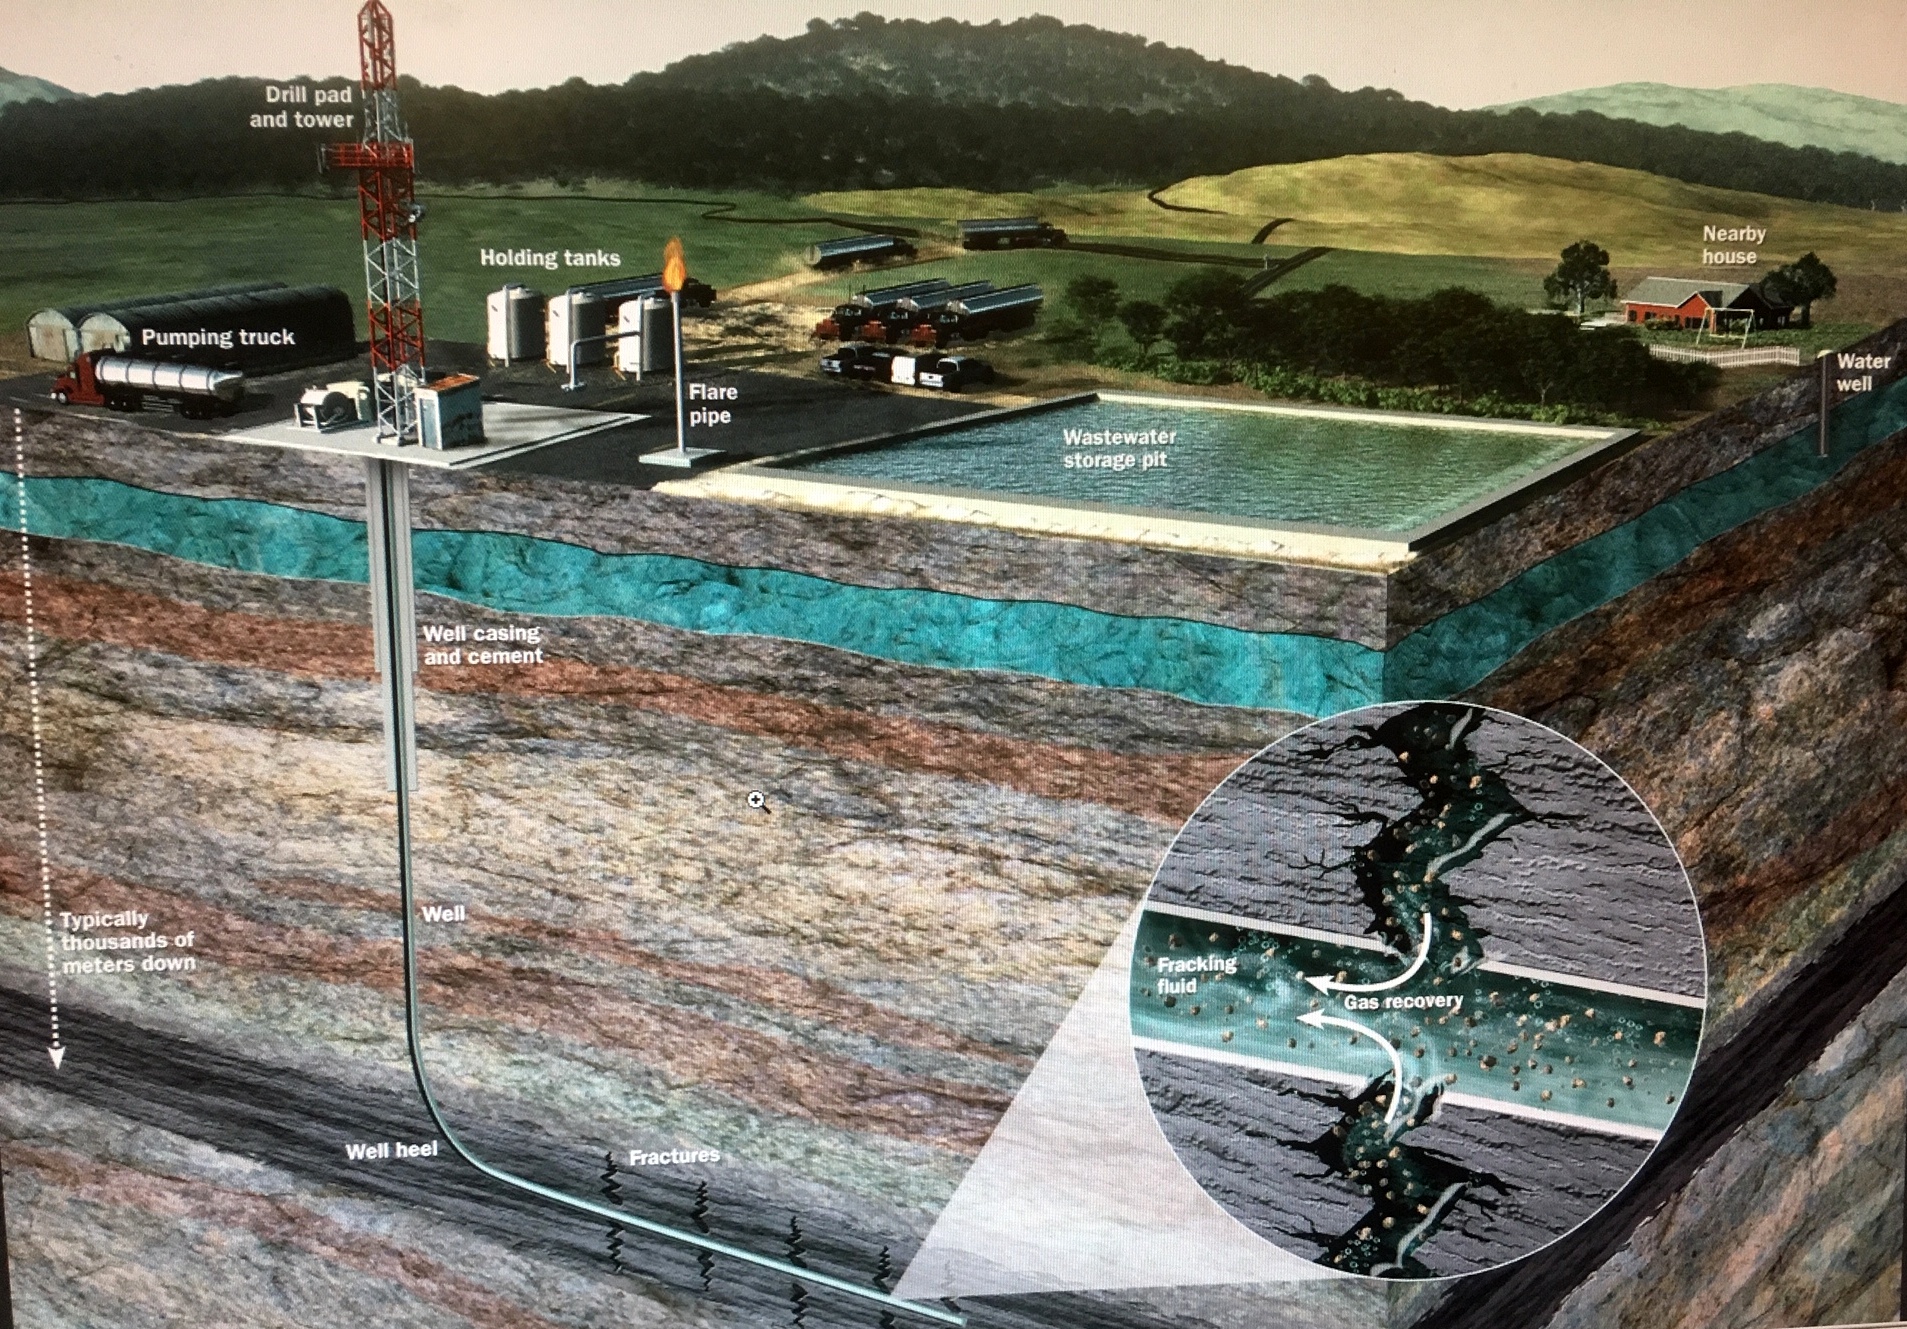
Idealized conception of fracking source http://greenplug.nu/hydraulic-fracturing-what-is-hydraulic-fracturing/
Summary By holding yearly methane emissions constant or falling for the next ten years and keeping them on that track thereafter, humanity could arrest that gas’s outsize additions to atmospheric heat-trapping. Letting methane emissions rise year after year as they are almost certainly doing destroys all hope of keeping average global surface temperature in a tolerable range after 2030.
Production of total natural gas has risen worldwide 2006 – 2018 by 26% over ten years; that of “unconventional” [i.e. “fracked”] gas has gone up by 24% of baseline every year, with about two thirds of that increase from the USA. This trend is expected by the gas industry to continue for years . Losses from the natural gas supply chain are thought to be the major source of human-influenced methane emissions; this purposeful boost of natural gas production will increase methane emissions by roughly 2.6% yearly when it is imperative that the world throttle them down to a steady or declining rate. The growth plan of the gas industry, especially that in USA unconventionals , must be opposed at every level of civic, national and international society.
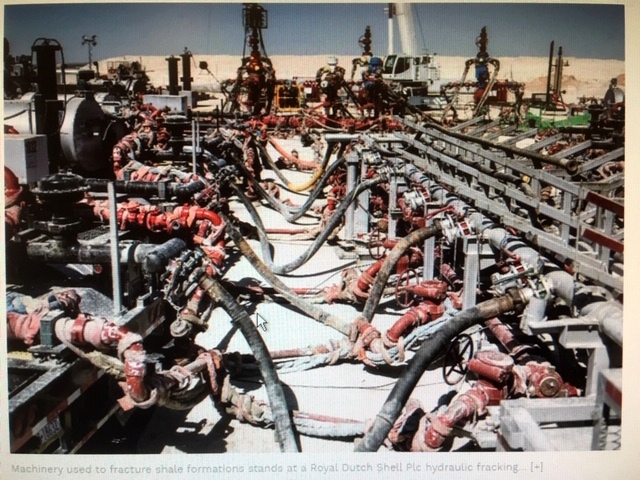
Another view of fracking, A Royal Dutch Shell site near Mentone TX 2017 photo by Matthew Busch/ Bloomberg
Methane is the second-most important greenhouse gas (GHG) next to CO2. It accounts for about 20 % of the current heat-trapping capacity of the atmosphere, CO2 for about 70%. Over the next decade, even if annual emissions decrease, methane from human-influenced sources will add to atmospheric heat-trapping the equivalent of many billion metric tons of CO2. Unlike that of CO2, however, methane’s role in atmosphere heating is susceptible to mitigation by feasible (though, sad to say, unlikely) human actions over a decade or two. The next section explains why.
The original methane molecules in a one-time pulse emission have almost entirely vanished from the atmosphere by about ten years after, turned in the atmosphere’s highly oxidizing “methane sink” into (mostly) CO2. Therefore, how methane is entered into calculations of atmospheric heating over a future time span (e.g. 2030-2040) depends entirely on whether yearly emissions over the previous ten or so years (say 2020-2029) have been steadily rising, steadily falling or stably plateaued and whether those trends hold for the ensuing decade. Using the two time spans above as inexact illustrations, it can be said that if annual global human-influenced methane emissions year on year are exactly the same from 2020 to 2035, then from around 2030 on methane emissions will no longer be adding to atmospheric heating as they had been up to 2029, though they will still contribute to it. This is because with the emission rate unchanging all or most of the methane molecules that entered the atmosphere in 2020 will have disappeared by the time new ones enter at the 2020 rate ten years later; so, there is one-for-one replacement.
If emissions are lower year-on-year 2020-2029 and hold that course over the next ten years, some heat-trapping function will be removed from the atmosphere after 2030. Now, methane molecules that arrived in 2020 have dropped out and not been replaced one for one. Click here for a short paper by Dr Michelle Cain that gives more insight. Click here for an analogy made in pictures between layers of bedclothes and global surface temperature.
If, however, methane emissions rise steadily 2020 to 2029 and keep climbing, every molecule emitted in 2020 that has disappeared by 2029 is replaced by more than one in 2030. Methane inventory in the atmosphere keeps building. What would be the CO2 equivalent of those ongoing yearly methane additions to heat-trapping capacity after 2030 is not settled. It would be damning.
CO2 has a very different fate after entering the atmosphere. When terrestrial and aquatic systems that recycle CO2 or temporarily store (or even sequester it long-term) it are faced with more than they can handle, the gas builds up in the atmosphere as shown by the rising sawtooth Keeling Curve The accumulated inventory of CO2 does not decline over centuries, exerting all the while its heat-trapping capacity.
Methane molecules, as mentioned above, are mostly gone within ten years after entering the atmosphere, though they may be replaced depending on recent emission rates. Individual CO2 molecules reside only a couple of years in the atmosphere but when they move on in the carbon cycle they are always instantly replaced from that huge-capacity cycle. Thus, even if CO2 emissions were cut by 50% before 2020, that gas would keep adding to atmospheric heat-trapping indefinitely. If emissions went to gross zero, CO2 would no longer add to atmospheric warming but would sustain it in status quo for centuries unless drawdown (long-term removal from the carbon cycle into biodynamic soil or geologic repositories) could be effected.
Put another way, methane has a throttle on how it will add to future atmospheric heat-trapping that is theoretically very responsive to human actions over ten to fifteen years. There is no such throttle for CO2. Humankind must work the methane throttle. This means starting now (Sept 2019) to control all the sources of human-influenced methane emissions, the biggest one first.
There is now good, not ironclad, evidence that the largest share of human-influenced methane emissions globally is related to fossil fuel extraction and distribution; further, that emissions from these sources are rising, at least in the last few years. Professor Robert Howarth at Cornell has called attention to these observations from his own work and that of others.
bn cm billion cubic meters
COP21 2015 Conference of Parties at the UN Climate Change Conference in Paris
E+6 N E+6 means the value N to the sixth power = million N N E+3 = thousand N used to avoid lots of zeros, values given in words and superscripts for exponents
EIA Energy Information Administration (US govt)
IEA International Energy Agency
Mmt 1 million metric tons usually used for CO2
NG natural gas
Tg 1 million metric tons = megaton usually used for methane
In his August 2019 paper in Biogeosciences Howarth used data from EIA and from IEA demonstrating an increase between 2005 and 2015 in conventional production of natural gas (NG), with a greater relative increase in unconventional. In the USA especially, unconventional gas is almost synonymous with horizontal hydraulic fracturing or “fracking.”
Howard’s citing an increase in conventional production 2005-2015 struck me because p. 14 of the 2018 Global Gas Report showed that over 2010-2016 the entire increase in NG production was from unconventional. Those data were from Rystad Energy. I wanted to understand whether the 100% share of increased production by unconventional in the Global Gas Report was due to the shorter time span reviewed in that graph or if Howarth had understated the pre-eminence of unconventional. [The answer to that is in the appendix; it was the different time spans. Howarth’s figures are borne out perfectly in a longer time series .] Working this out highlighted the explosive rise of fracking, particularly in the USA. The rest of this paper concerns the threat posed by the global natural gas industry and in particular, the US fracking industry to climate mitigation objectives like keeping the global surface temperature anomaly less than + 1.5C by 2030
Rystad Energy made much of their vast data base available to me through the platform UCube Free. Graph 1 depicts the 58% rise of world production between 2000 and 2018.
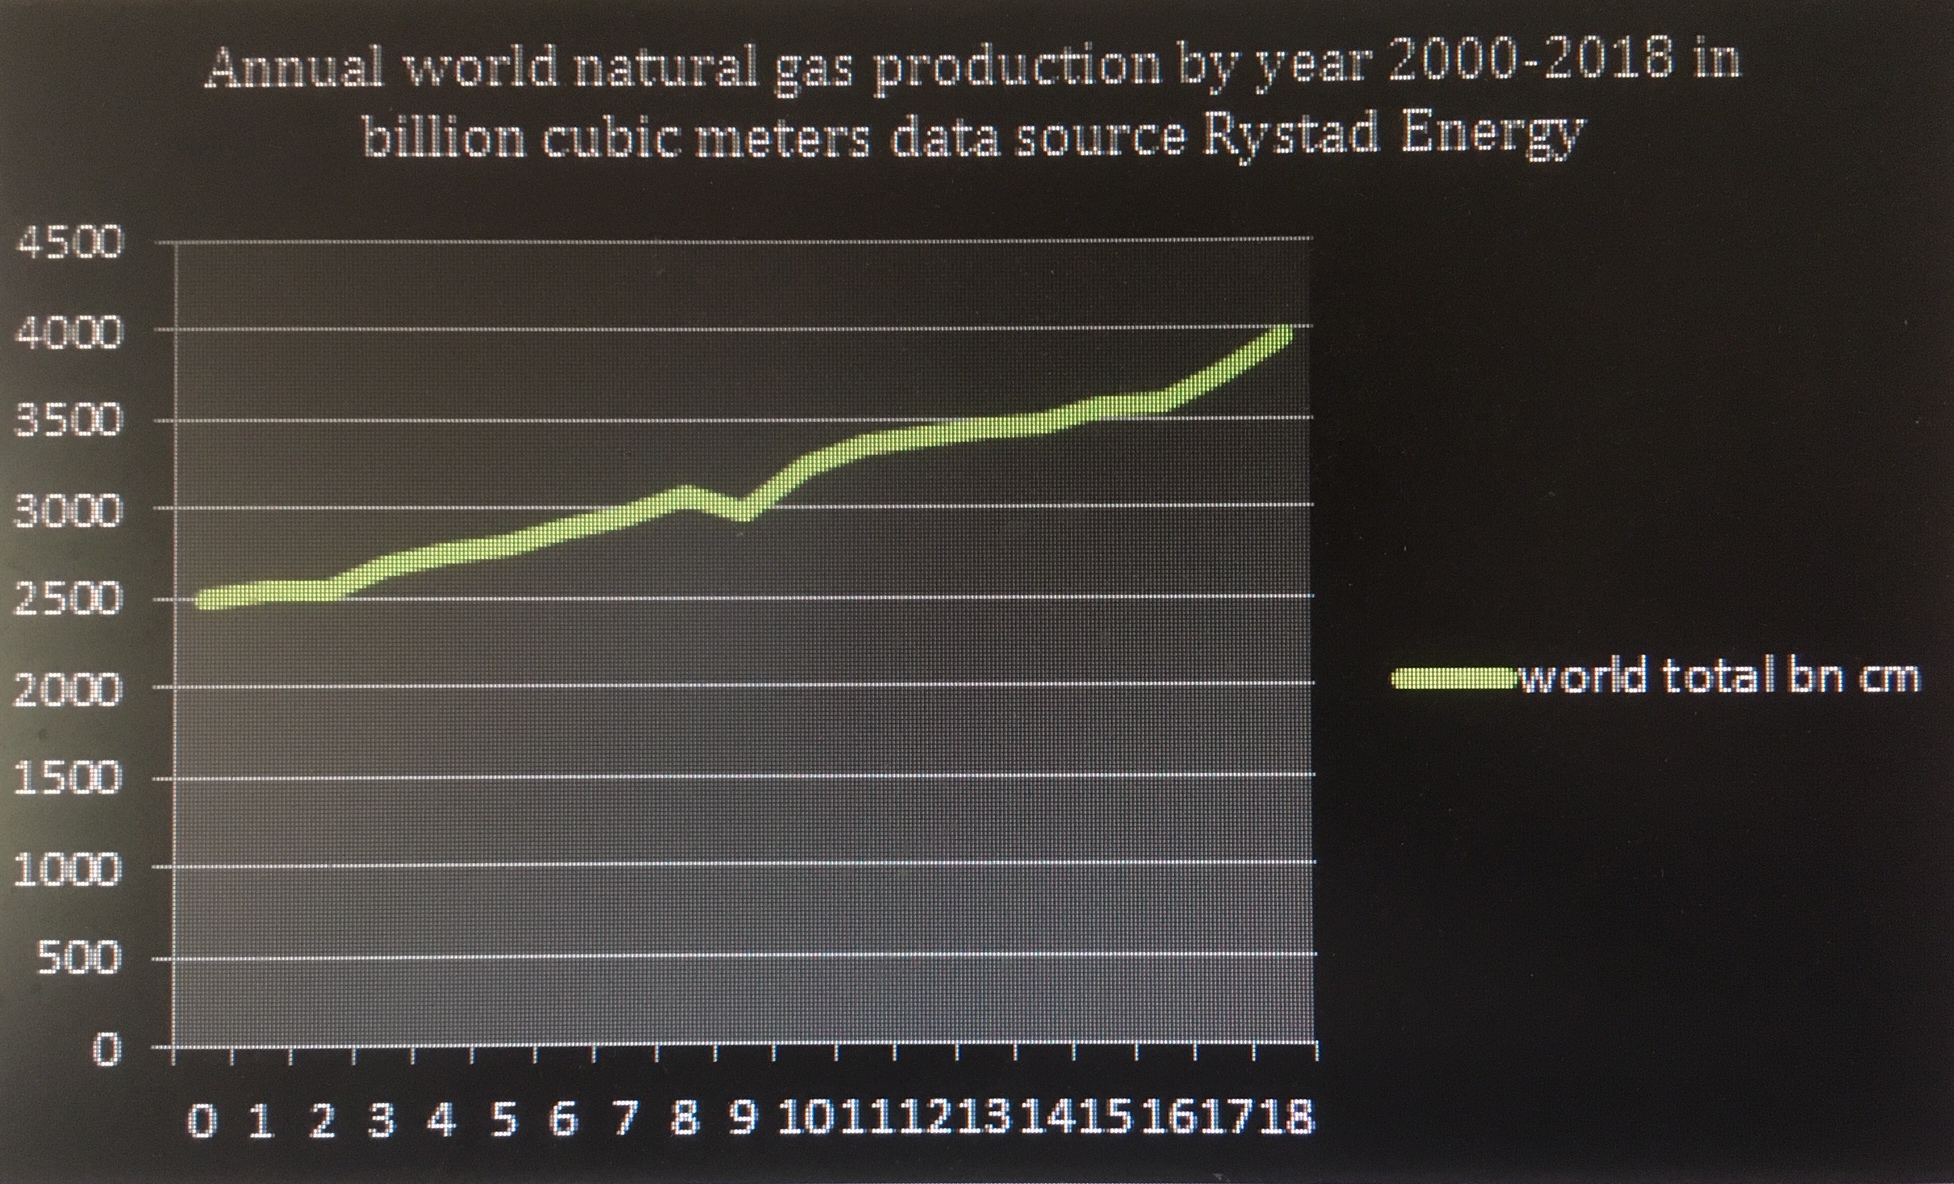
Graph 1. World annual natural gas production, by year, 2000-2018 in billion cubic meters/yr Data from Rystad Energy graph by Shafer
UCube allows gas to be split between conventional and unconventional. I believe the latter category includes shales, tight gas and coalbed methane. The last-named is hardly significant in the USA, where hydro-fracking dominates; it was only 4% of USA unconventional in 2015. Worldwide, it must have a bigger share of unconventional. Howarth considers it separately from either category. Subdividing total production by method and region gives Graph 2 below.
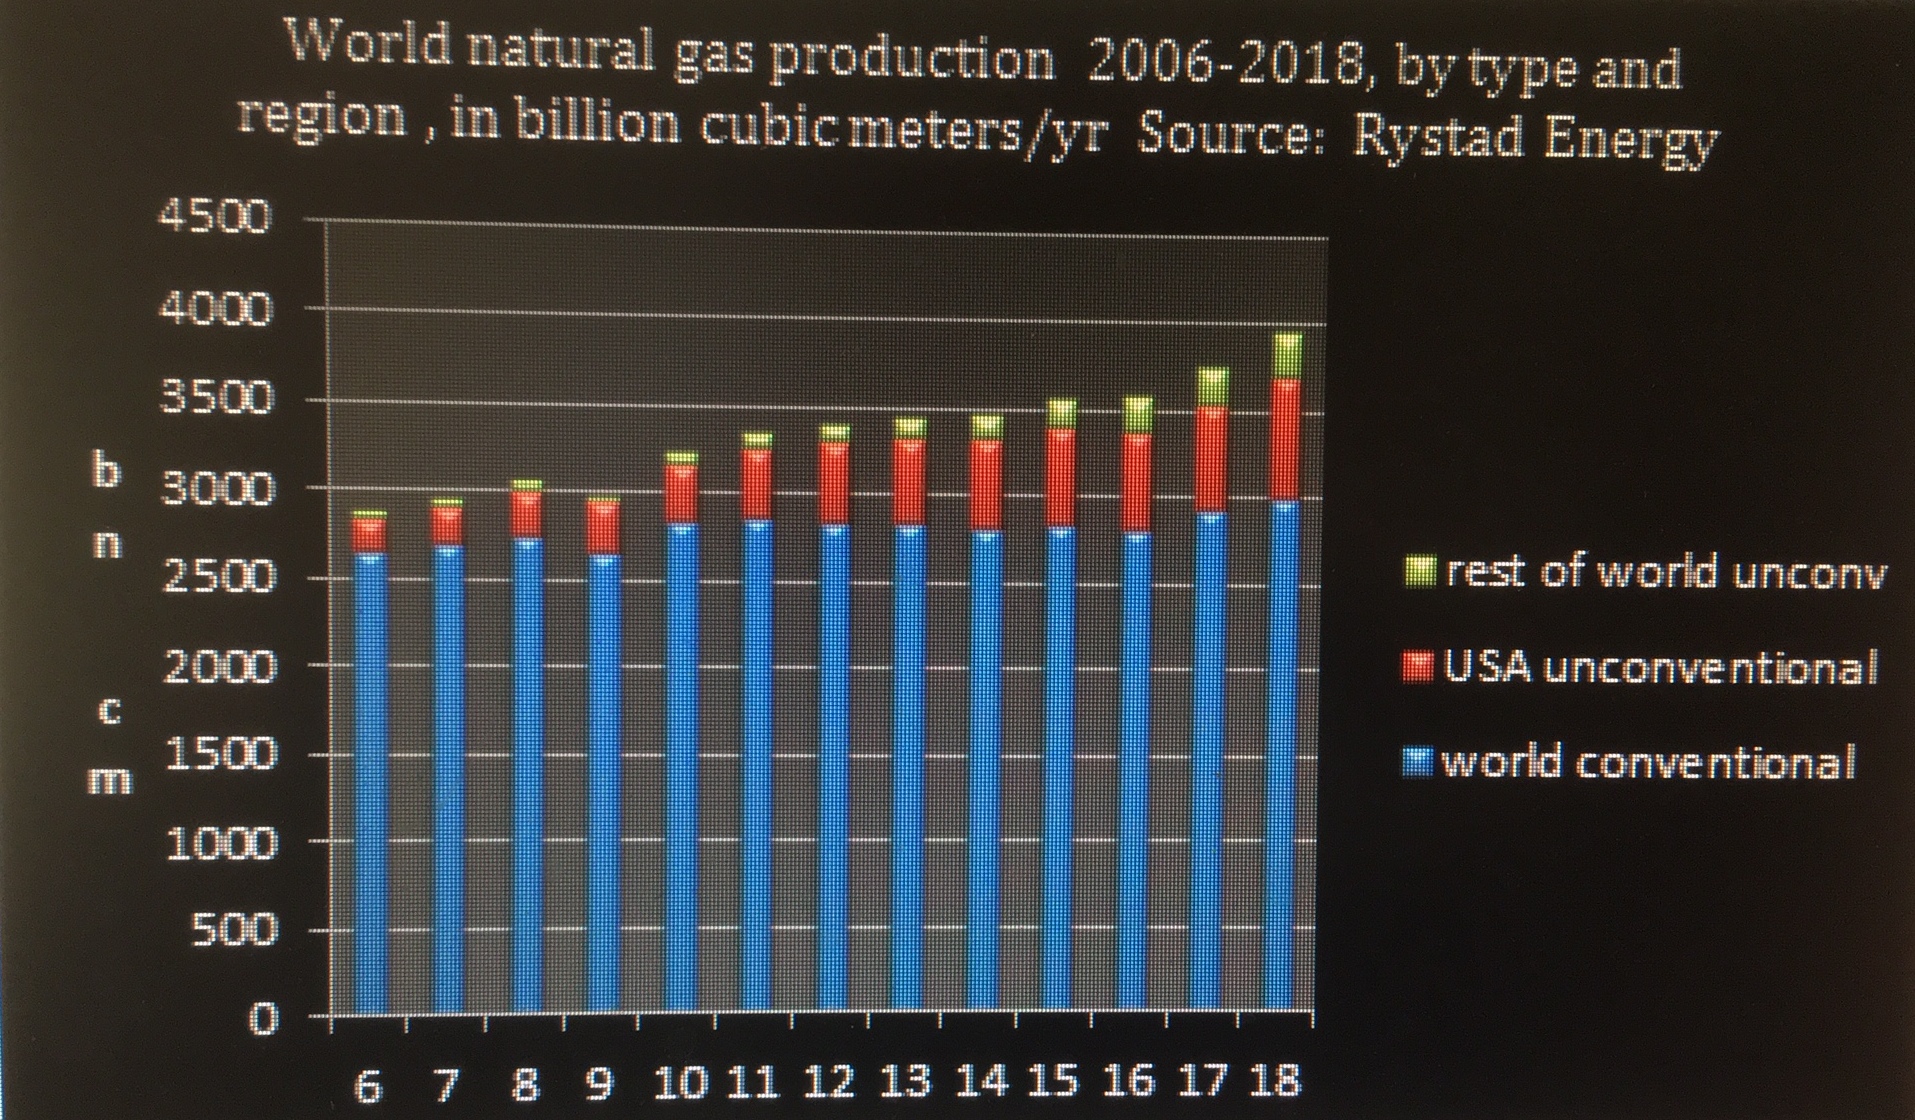
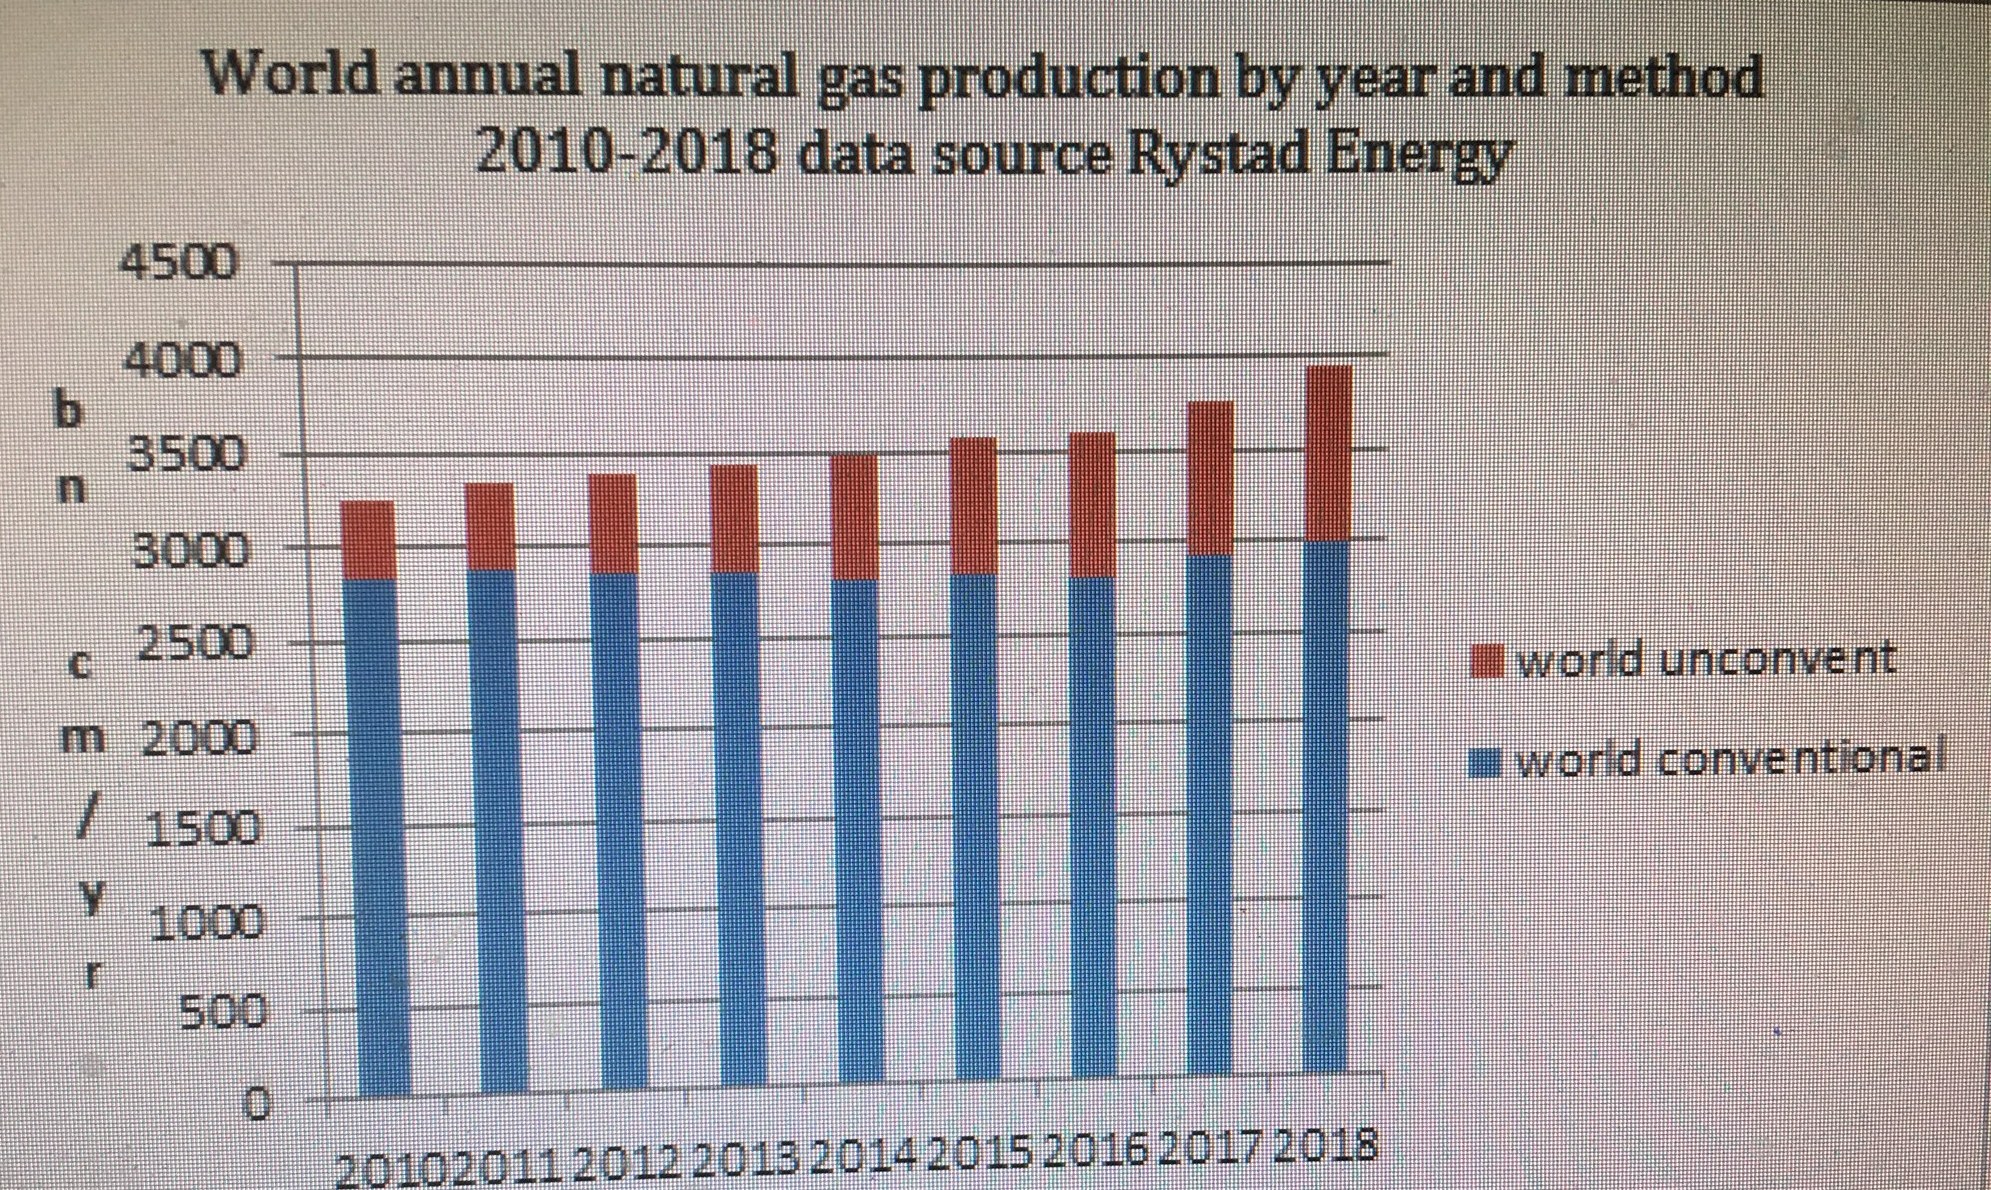
Graph 2. World annual natural gas production 2006-2018 by production method (conventional v. unconventional) and region of production. Data source Rystad Energy Graph by Shafer
Graph 2 makes clear that conventional production (blue segment) was flat 2010-2016 then rose slightly 2017-2018. Between 2006 and 2018, however, there is a visible up-trend at an average of 1% per year. Unconventional production (red and green segments) rose steadily 2006-2018 by an average of 26% per year, with USA always dominating. In 2018 USA accounted for 702/957 = 73 % of unconventional, Canada for another 123/957 = 13%. Total production rose from 2891 in 2006 to 3955 in 2018, an average of 3% per year. As of 2018, 68% of the total increase above 2006 was in the unconventional sector, 71% of which came from the USA.
Looking only at the sub-interval 2010-2016 shows that all the increase over that shorter period was in fact due to unconventional. Using the Rystad data base to compare 2005 to 2015 as does Howarth with EIA and IEA data, however, there is a difference in total annual world production of + 769 billion cubic meters between the extremes of the series. 68% of the increase in 2015 is in unconventional gas, 75 % of which is from USA alone.
A closer look in Graph 3 below at conventional production 2006-2018 shows Russia, the leading producer of conventional, holding steady; the USA going down; and the rest of the world trending up.
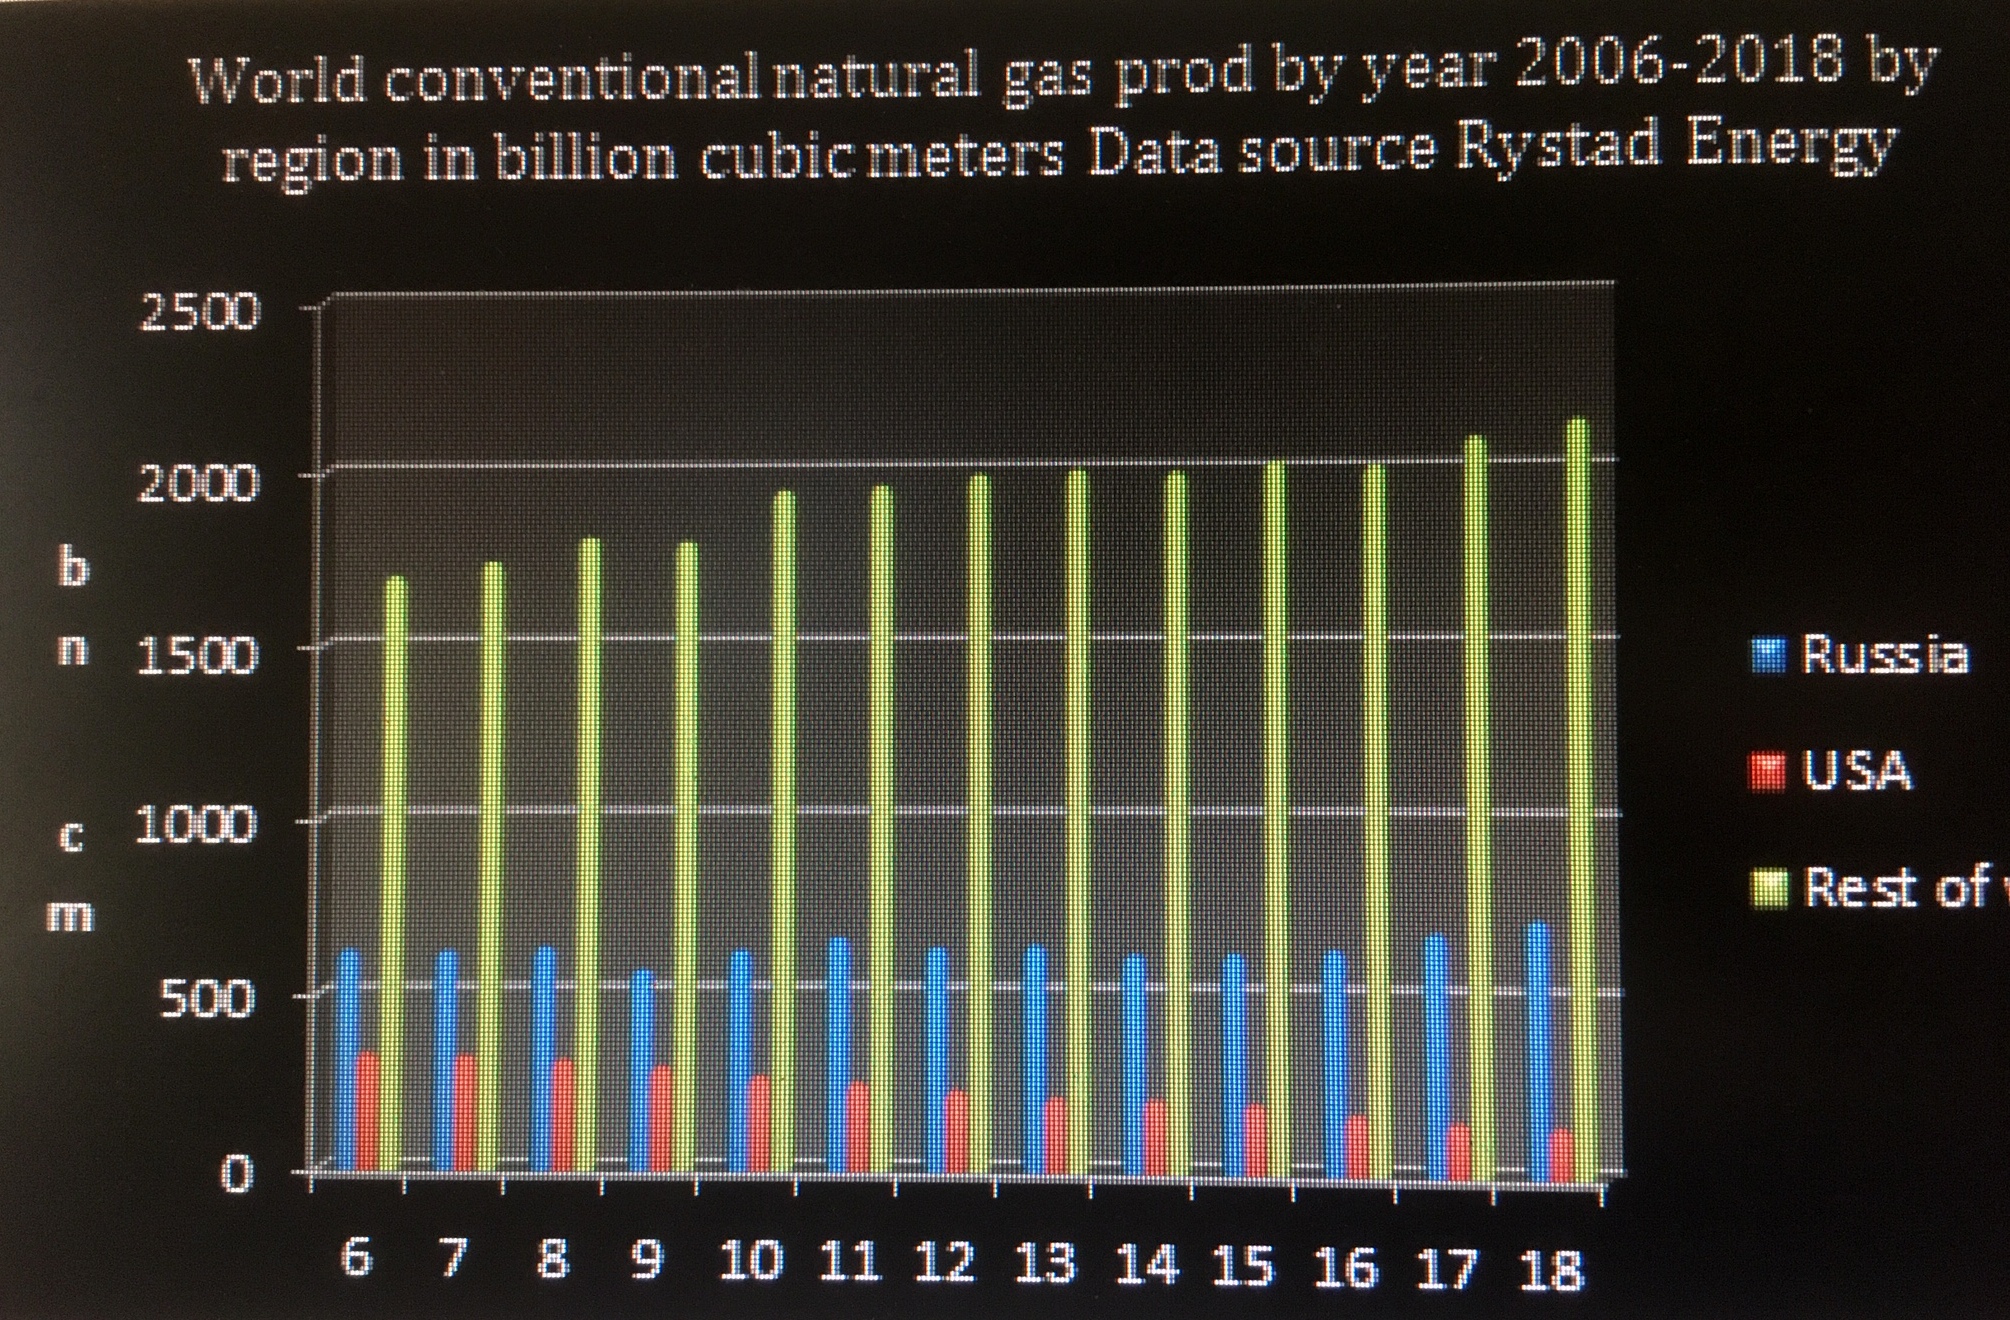
Graph 3. Annual world conventional production of natural gas by region. Data from Rystad Energy graph by Shafer
The downslope in USA conventional is related to the phenomenal upsurge in unconventional due to fracking shale. This crossover is evident in Graph 4 below.
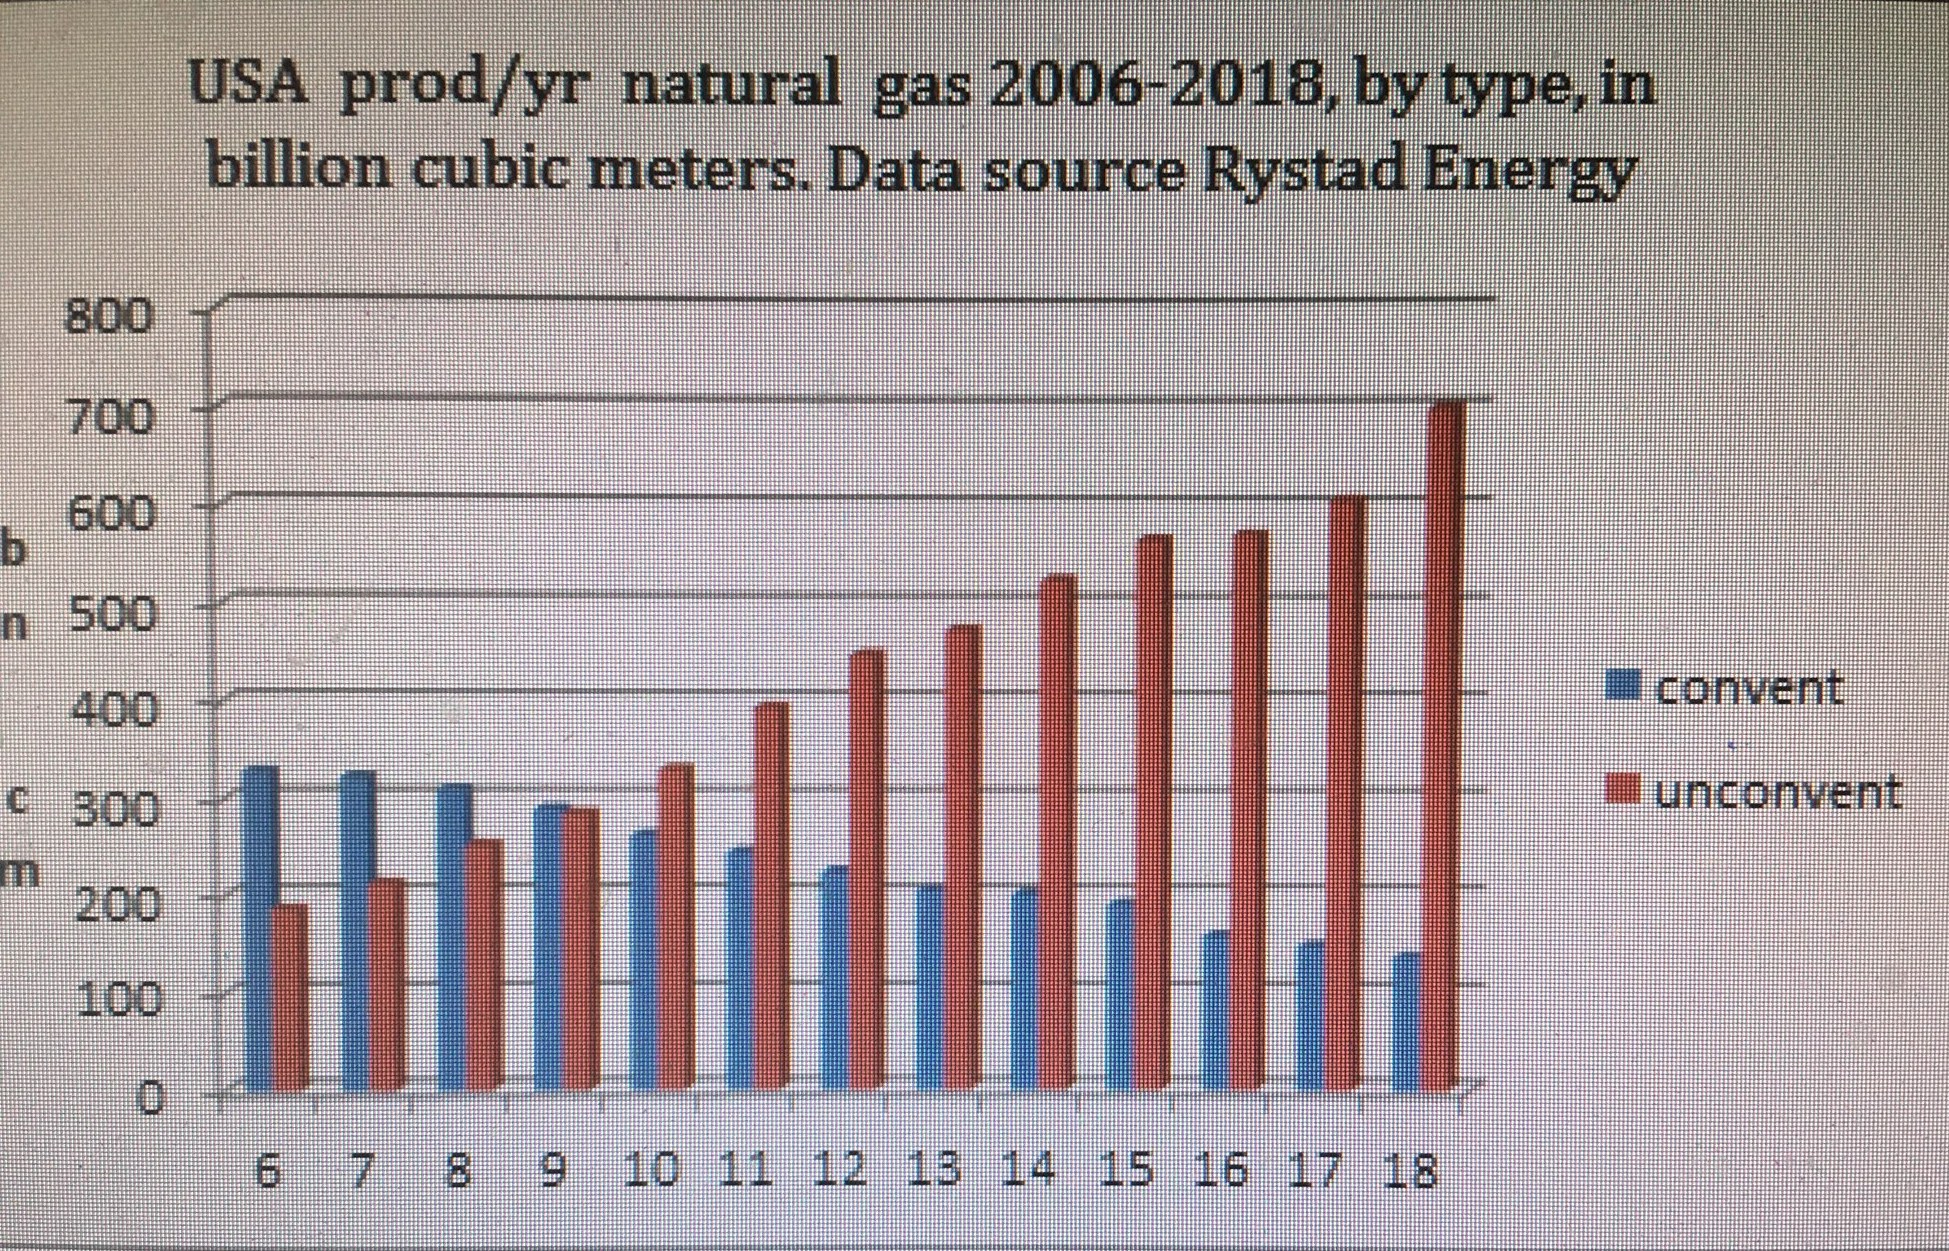
Graph 4. USA annual production of natural gas 2006-2018, by production method Data source Rystad Energy graph by Shafer
Given the consensus that some methane is lost in the natural gas supply chain, Howarth looked at the question of how much methane emitted yearly could be due to increased quantities of natural gas put yearly into that chain. He assumed a loss proportion of 3.5%, a value lower than the median in twenty-nine reports tabulated by Raimi and Aldana.
To convert an annual increase of Y billion cubic meters of natural gas entering the supply chain to Tg of methane lost to atmosphere from the chain at 0.035 loss proportion, one shortcut formula, assuming that natural gas is 93% methane, is this:
0.65 E-03 mt CH4/cm NG * Y E+9 cm NG * .035 = .023 Y E+6 mt
Example In 2018 702 bn cm of unconventional gas was produced in USA , 514 bn cm more than the 188 bn cm produced in 2006. This increment, at a loss proportion of 3.5% , yields estimated increased emissions of 514 cm * .023 E +6 mt/cm = 11.8 Tg CH4 in 2018 from US unconventional gas. Table 1 below shows two overlapping time series, both using data from Rystad Energy. 2005-2015 are the years Howarth uses in his 2019 paper. The second series runs longer than the first.
2005-2015 2006-2018
World conventional 5.7 7.8
USA nonconvent 9.1 11.8
ROW nonconvent 2.9 4.9
Total 17.7 24.5
Table 1. Increase in Tg/yr CH4 estimated lost from NG supply chain in last year of series above that estimated lost in first year, by type of production and region. ROW= rest of world. Data source Rystad Energy
For the earlier, shorter, series the figures in Table 1 are close to those in Howarth. He gives shale natural gas 9.4 Tg, conventional 5.5 and all oil + coal sources 2.9 . I think coal-source (1.3 Tg) methane he does not count as either shale or unconventional, though it is counted in table 1 as ROW unconventional. I do not know why Howarth seems to count all US unconventional as “shale,” though shale has much the biggest share, and it is expected to grow. According to EIA, US unconventional production in 2015 in trillion cf was 13.6 shale, 5 tight, 5.3 “other” 1.7 offshore lower 48, 1.2 coalbed and 0.3 Alaska.
In the epoch ended in 2015 the size of the step-up in total production is ominous. Even a small (and this is not small) annual increase in methane emissions during the ten years after that sabotages chances of gaining the aspirational COP-21 objective of having the “temperature anomaly” under or at + 1.5 C in 2030. [“Temperature anomaly” is shorthand for the difference in average surface global temperature of a given year and the average in a “pre-industrial” baseline year such as 1850. The anomaly is usually written in degrees Centigrade such as +1.5 C.] The picture is worse still over the longer overlapping epoch that ended in 2018, for which Howarth did not have data. Roughly half the increase in either epoch is from USA unconventional, which I assume is mostly from fracked shale. The following subsection will highlight this predicament.
In 2005, after 5 years of quite slow growth, world production of natural gas by all methods was 2,800 billion cubic meters. The difference between that rate and the rate in each subsequent year is plotted in Graph 4 below to show increase in that year above the 2,800 bn cm baseline. The cumulative difference over twelve years was + 7190 bn cm. Using the formula above 0.65 E-03 mt CH4/cm NG * Y E+9 cm NG * .035 = .023 Y E+6 mt converts the additional 7190 bn cm put into the supply chain over those years into 165 Tg of methane emitted from the system unburned. The US share (all from unconventional methods) of those 165 Tg comes to 123 Tg, about 75% of the whole.
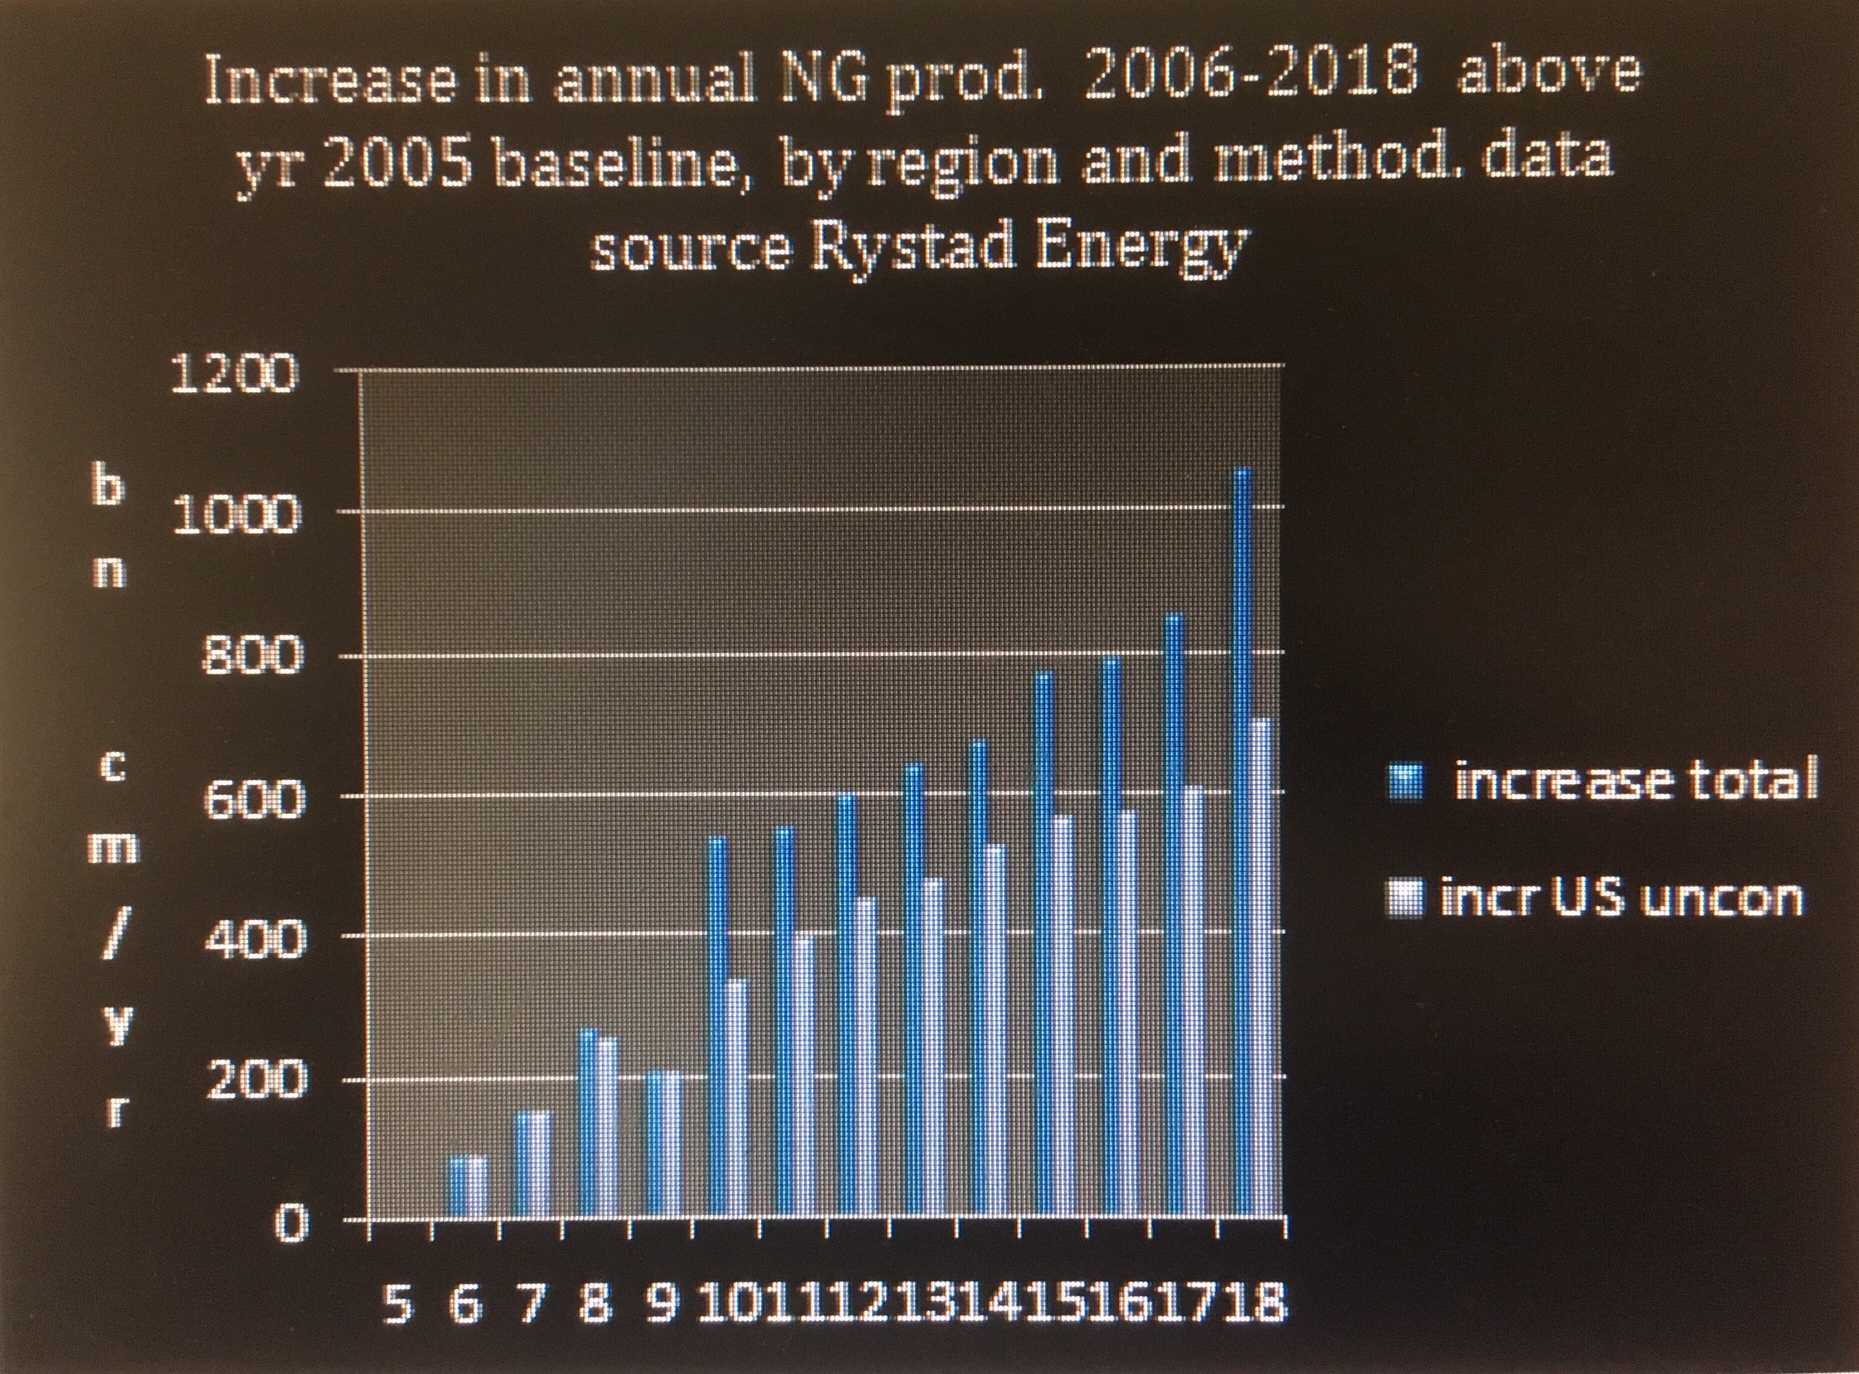
Graph 5. Increase in annual natural gas production between 2006 and 2018 compared to baseline rate in 2005, for whole world all production methods and for USA unconventional data source Rystad Energy graph by Shafer
Important point: Those 165 Tg are not the total emissions of methane from the world natural gas supply chain 2006-2018. Far from it, they are just a fraction of the total, being the emissions that would have been avoided if world production had stayed at the 2005 level rather than ramping up as it did. The total emissions in that scenario assuming a loss proportion of 3.5% over these thirteen years would have been 2800 bn cm/yr * 13 yrs = 36400 bn cm = 837 Tg methane for an annual average of 64 Tg. If the emissions due to increases above the 2005 baseline are added the yearly average is 77 Tg methane.
Global production is forecast to continue rising 2019-2023 at the same average annual rate of change ( + 2.6%) as characterized 2006-2018. US unconventionals are expected to propel the future rise as they did the past surge. Graph 6 highlights the rate of increase 2006-2018 and the extrapolation thereafter by showing only increase over 2005 baseline, not total production.
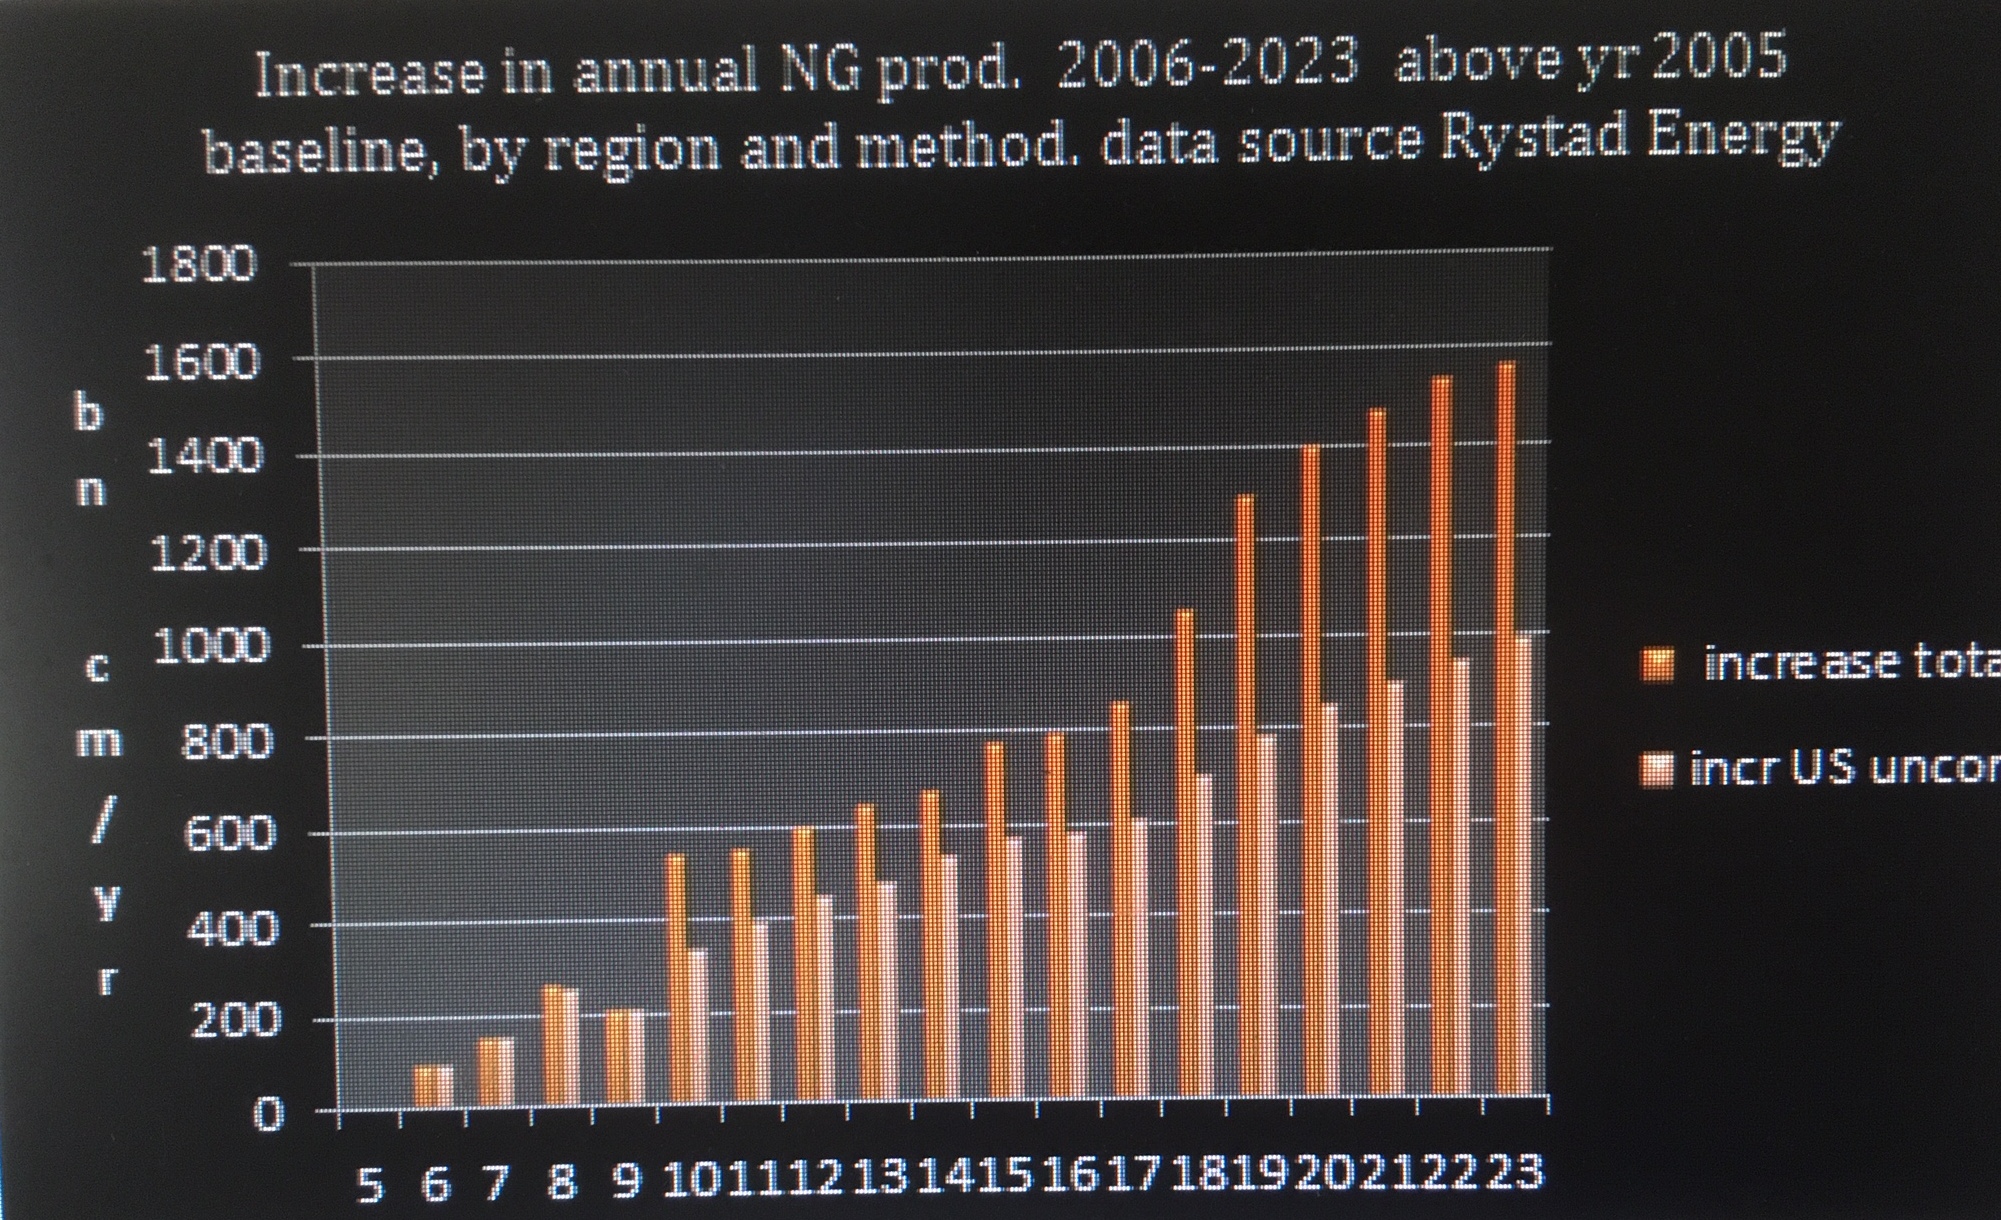
Graph 6. Actual (up to 2018) or forecast (2019-2023) increase in global annual natural gas production above 2005 baseline of 2800 billion cubic meters/yr, by region and method data source Rystad Energy graph by Shafer
Discussion. This paper has used Howarth’s observations and inferences to propose a model too simplistic to be ascribed to him: the mass of methane annually emitted from the global natural gas supply chain is directly related to the annual global volume of natural gas put into that supply. The two quantities in this model are related by a loss proportion factor. A reasonable value for that is 3.5%, though it’s not one on which all parties will agree. See Methane Madness, an earlier blog in this series. Gas industry promoters point to studies with values below 1% while critics cite estimates as high as 10% and above. In the proposed model, methane lost from that supply chain is an important component of total human-influenced methane emissions; how important depends on the loss proportion factor used. 3655 billion cubic meters NG produced in 2017 * .023 yields an estimate of 84 Tg methane emitted that year. This is less than the 157 Tg Howarth presented in a 2019 lecture for natural gas and oil in an unspecified recent year, but more than the 74 Tg he attributed to animal agriculture. The 157 Tg value was based on isotope ratios in atmospheric samples, not on total production of natural gas.
To have any chance of holding the global temperature anomaly after 2030 at whatever level obtains in 2030 , whether it is +1.5 C or a calamitous +2C, humanity must keep human-influenced methane emissions on an even keel or a decline from 2020 to 2030 (and beyond). They need not be cut back 50% over that decade, but they must not increase. Given that climate imperative, where do we stand in August 2019 ?
Based on the simple model I have proposed as a disciple of Prof. Howarth who has never met him, we stand in a very bad place. Just when it is imperative for climate health that methane emissions not rise, a major American industry is counting on boosting American and thereby global natural gas production (mostly via fracking). This deliberate, heavily promoted push is based on the fact that on average natural gas emits less CO2 on combustion than does coal per btu. That promotional gambit completely disregards fugitive methane emissions in messaging to the public. When made to recognize their existence, the industry claims it has financial motives plus the technical knowledge to lower them. Yes, it knows how; no, it has no motive so long as gas is cheap. This profit over science attitude contrasts to its discredit with the attention given to methane in other sectors such as animal agriculture, paddy-rice growing and landfills. These sectors don’t have rapid easy fixes in sight, but are clearly making an effort to level off and start decreasing methane emissions even while feeding more people and facing more waste. For example, California has set ambitious objectives for reducing methane from dairies.
It’s worse than regrettable, it’s tragic, that so many sincere environmentalists, environmental scientists and enviro-journalists are forced to spend more time debating the utility of meatless Mondays or the ethics of jet travel than challenging the natural gas industry to stop growing. To join a movement that contests the permit for a new pipeline or contact a legislator about a ban on new fracking wells or even talk to the City Council about banning new natural gas installations as Berkeley CA did – every climate activist should be doing things like these.
Appendix
During 2010-2016, nearly all the increase in world production was indeed from unconventional as the graph below shows. In 2017 -2018, however, and over the entire span, 2006-2018 unconventional contributed most, but not all of the increase. The figures in this graph for 2010 differ very slightly from those in the graph on p. 14 of the Global Gas Report 2018.
Acknowledgments: I thank for their gracious help in my exploration of methane and my other climate projects the following scientists: Michelle Cain, Oxford Martin School, University of Oxford; Ruth DeFries, Columbia University; Gidon Eshel, Bard College; Steven Hamburg, Environmental Defense Fund; Robert Howarth, Cornell University; John Lynch, Food Climate Research Network University of Oxford; Frank Mitloehner, UC Davis; Bryce Payne, Wilkes University and Gas Safety, Inc; Sara Place, National Cattlemen’s Beef Association; Jeanne Stellman, Columbia University; Evelyn Wright, Sustainable Energy Economics, Kingston NY Thanking them does not imply their endorsement. I am responsible for any errors of fact or interpretation. All opinions expressed are my own.
Thanks also to Rystad Energy for giving access to their UCubeFree and support in learning to use it.
Stephen Q. Shafer MD MPH MA Saugerties NY sqs1@columbia.edu 917 453 7371 September 27 2019
Permission to cite or reproduce this paper is hereby given as long as there is a link to http://www.anchorageromneys.com/2019/09/methane-manifest/